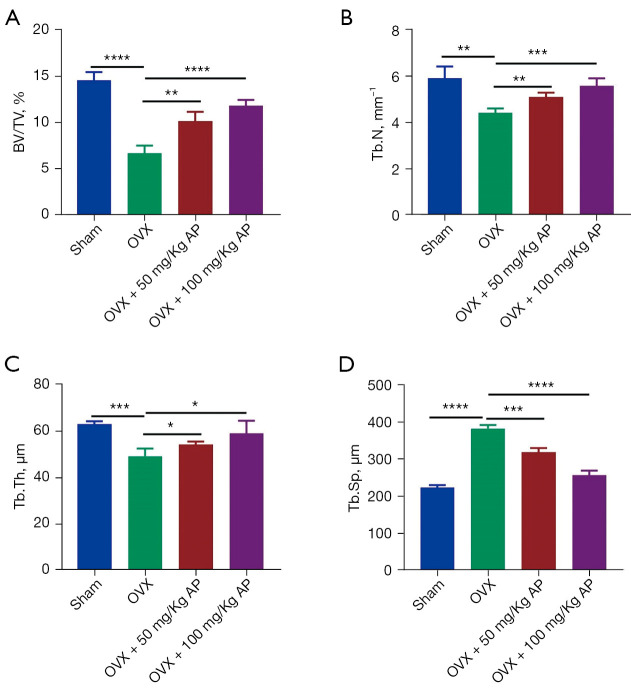
Figure 1.
AP treatment and bone loss in osteoporotic mice. (A-D) Quantitative micro-computed tomography analysis of trabecular bone microarchitecture in femurs from sham, OVX, OVX + 50 mg/kg AP and OVX + 100 mg/kg AP groups of mice. n=6 per group. Data are presented as mean ± SD. *, P<0.05; **, P<0.01; ***, P<0.001; ****, P<0.0001. AP, Andrographis paniculata; BV/TV, bone volume/tissue volume; Tb.N, trabecular number; Tb.Th, trabecular thickness; Tb.Sp, trabecular separation; OVX, Ovariectomy; SD, standard deviation.

