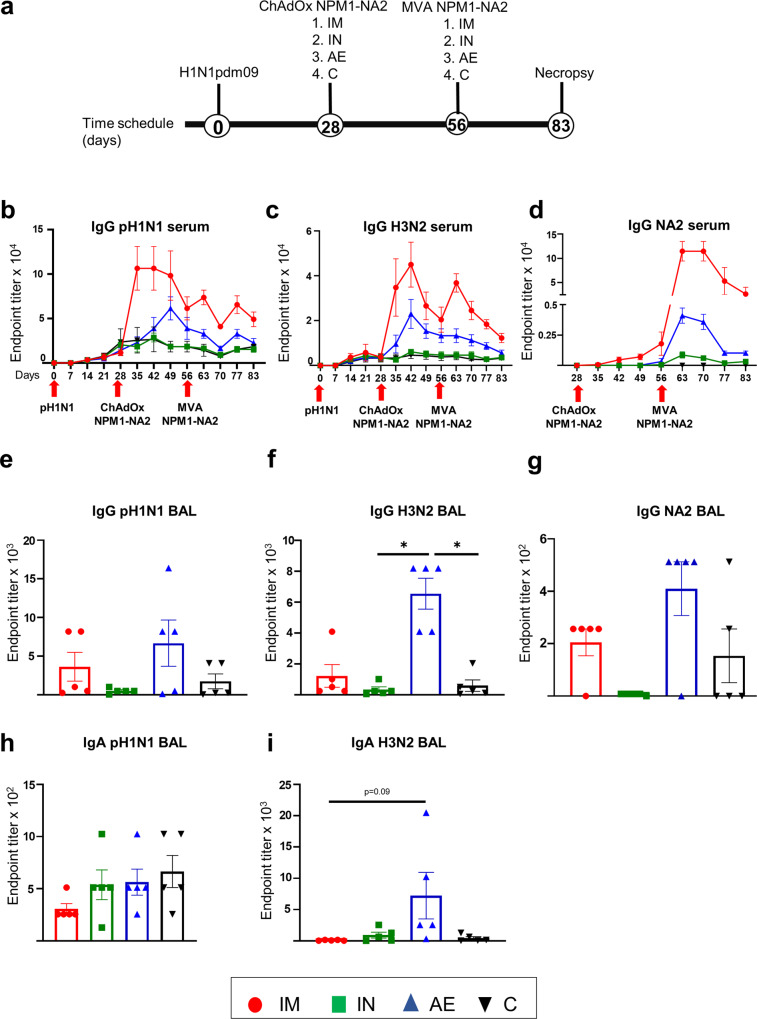
Fig. 1. Experimental design and antibody responses.
Twenty pigs were infected with pH1N1 and four weeks later were immunized with ChAdOx-NPM1-NA2 intramuscularly (IM), intranasally (IN) or by aerosol (AE). Four weeks later they were boosted with MVA-NPM1-NA2 and after further four weeks were culled. Weekly blood samples were collected. Control (C) animals were infected but not immunized (a). pH1N1 (b), H3N2 (c) and NA2 (d) specific IgG responses in serum were determined by ELISA at the indicated time points. pH1N1 (e), H3N2 (f) and NA2 (g) specific IgG and pH1N1 (h) and H3N2 (i) IgA responses in BAL, were determined by ELISA four weeks after the second immunization. The mean and standard error (SEM) is presented in each time point (b–d). The arrows below D0, D28 and D56 indicate the time of pH1N1 challenge and immunizations with ChAdOx-NPM1-NA2 and MVA-NPM1-NA2. Significant differences are listed in Table 1. The top of each bar indicates the mean and the line the standard error mean (SEM) (e–i). Each symbol (circle, square and triangles) represents one animal. Asterisks denote significance between indicated groups (*p < 0.05) and were analyzed either by one-way (h, i) or two-way (b–d) ANOVA and Bonferroni’s multiple comparisons test when the data were normally distributed or with Kruskal-Wallis and Dunn’s multiple comparisons test when normality was not achieved (e–g).

