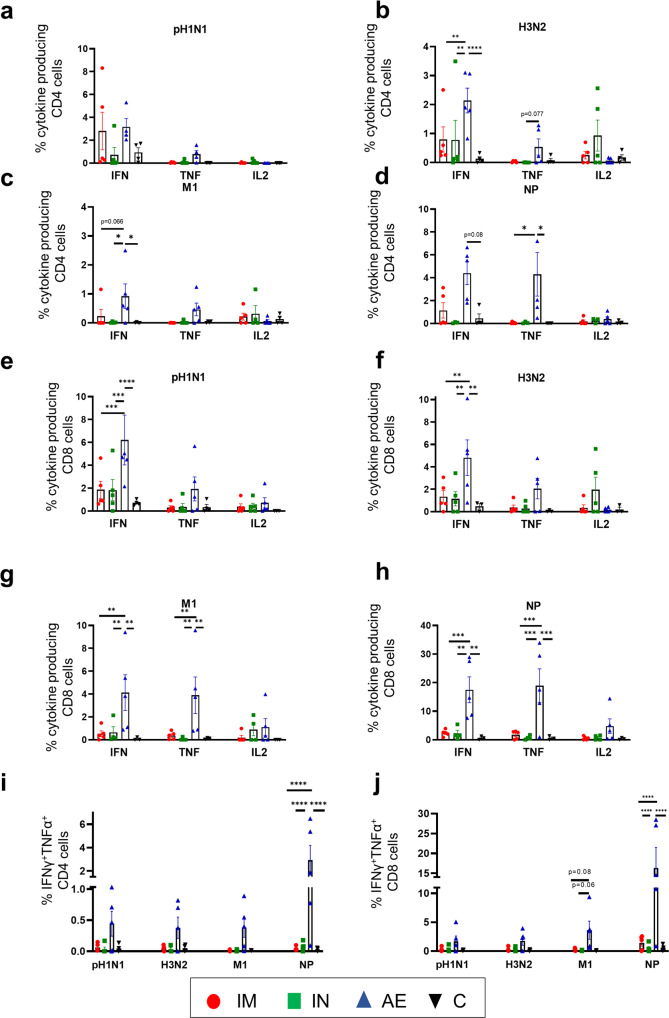
Fig. 4. T cell cytokine responses in BAL.
BAL was collected four weeks after the MVA-NPM1-NA2 immunization. Cryopreserved cells from D83 were thawed, stimulated with pH1N1, H3N2, NP or M1 and IFNγ, IL-2, TNF and IFNγTNF cytokine secretion was measured in CD4 (a–d, i) and CD8 (e–h, j). T cells by intracellular cytokine staining. Each symbol represents an individual animal, the top of the bar the mean and the line the standard error (SEM). Two-way ANOVA and Bonferroni’s multiple comparisons test were used to compare responses between groups and asterisks indicate significant differences (*p < 0.05, **p < 0.01, ***p < 0.001, ****p < 0.0001).

