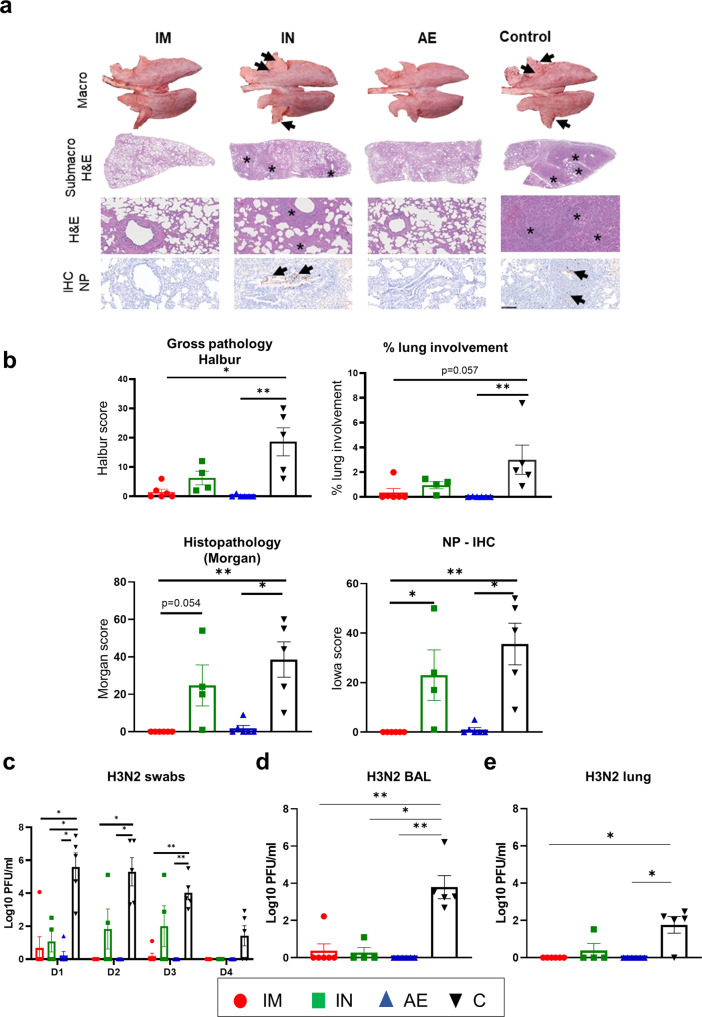
Fig. 5. Lung pathology and viral load following re-challenge with H3N2.
Representative lung gross pathology, histopathology (submacroscopic and microscopic) and immunohistochemical NP staining of each group. Gross pathology is observed as areas of consolidation (arrows). At submicroscopic histopathology, areas of bronchopneumonia are characterized by the obliteration of the normal airway structures, with inflammatory cell infiltration (*), that can be observed at microscopic level as bronchiolo- and broncho-interstitial pneumonia with necrosis of epithelial cells and inflammatory infiltrates in the airways and parenchyma (*). Virus NP is detected by IHC (brown stain, arrows) within the bronchiolar wall and luminae and occasionally within the parenchyma (a). Gross (top graphs) and histopathology scores are shown, including the percentage of lung surface with lesions, lesion scores and histopathology scores (b). Virus load was determined by plaque assay in daily nasal swabs (c) post H3N2 infection (D1-D4), in the BAL (d) and lung (e) 4 days post infection (D87). The top of each bar indicates the mean and the line the SEM. Each symbol (circle, square and triangles) represents one animal. Asterisks denote significance between indicated groups (*p < 0.05, **p < 0.01) and were analyzed either by one-way ANOVA and Bonferroni’s multiple comparisons test when the data were normally distributed (c) or with Kruskal–Wallis and Dunn’s multiple comparisons test when normality was not achieved (b, d, e). Bar = 100 micrometers.

