Figure 5.
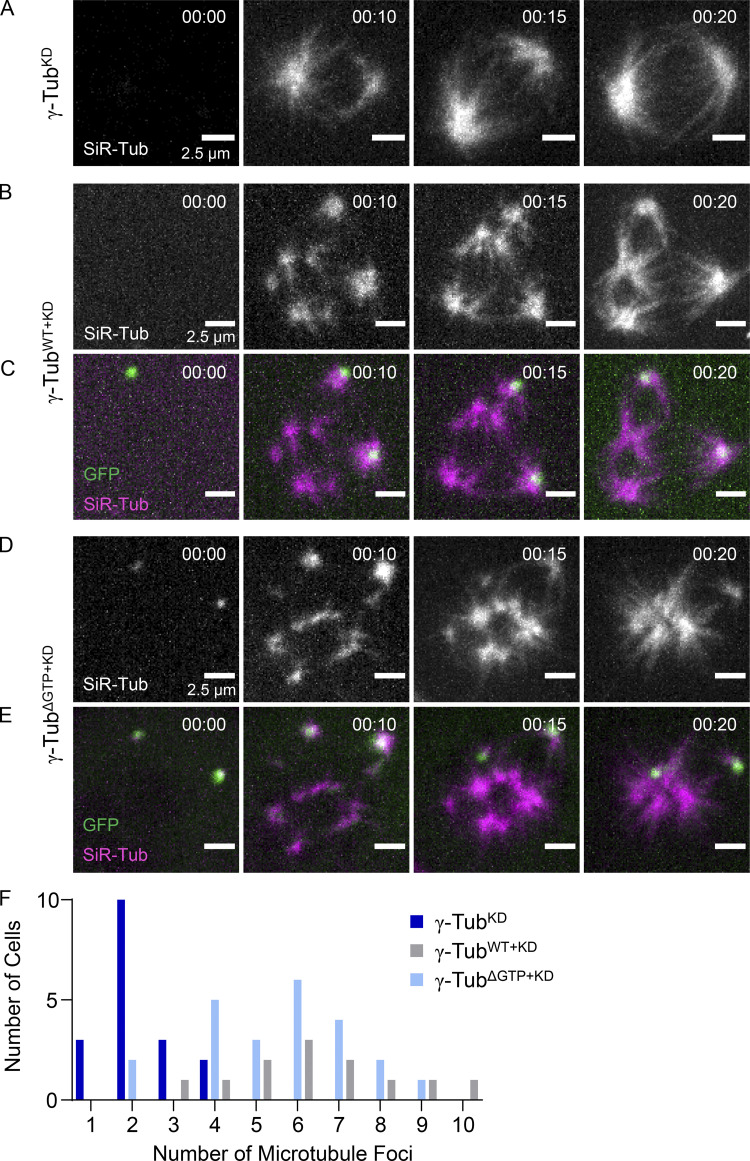
Microtubule foci formation and coalescence in live γ-tubulinΔGTP+KD cells. (A–E) Live imaging of microtubule regrowth assay by spinning disc confocal microscopy in γ-tubulinKD (A; no GFP signal), γ-tubulinWT+KD (B and C), and γ-tubulinΔGTP+KD (D and E) cells. Maximum-intensity projections at individual time points are shown. Timestamps = hh:mm. Single-channel images (A, B, D) show SiR–tubulin-labeled microtubules. Overlays (C and E) show GFP-tagged γ-tubulin (green) and SiR–Tubulin-labeled microtubules (magenta). Scale bar = 2.5 µm. (F) Quantification of the number of microtubule foci in γ-tubulinKD (dark blue bars, n = 18 total cells from N = 2 independent experiments), γ-tubulinWT+KD (gray bars, n = 13 total cells from N = 3 independent experiments), and γ-tubulinΔGTP+KD (light blue bars, n = 23 total cells from N = 3 independent experiments) cells.

