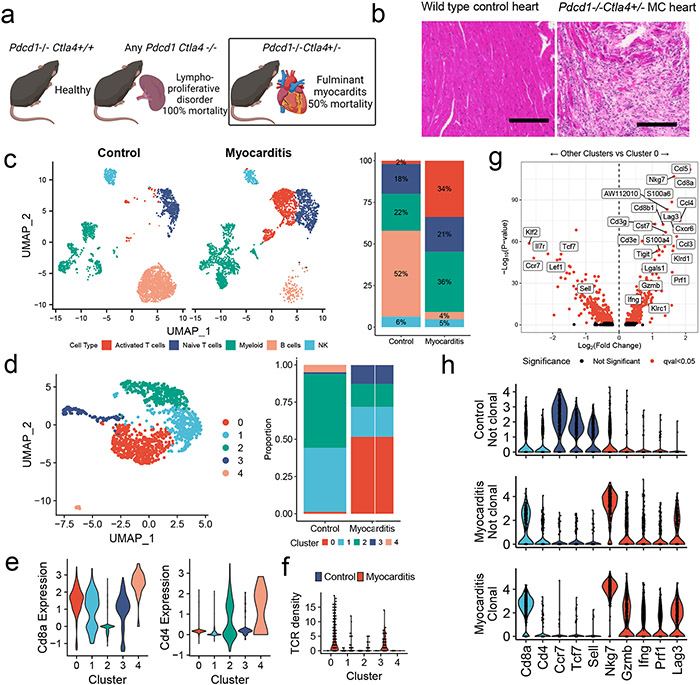
Figure 1. Single Cell RNA/TCR sequencing reveals abundant clonal effector CD8+ T cells in ICI-MC.
A) Phenotypic summary of mice with Pdcd1 and Ctla4 genetic loss. Pdcd1−/−Ctla4+/+ mice do not have an overt phenotype. Mice with complete loss of Ctla4 have a fatal lymphoproliferative disorder, regardless of Pdcd1 genotype. Pdcd1−/−Ctla4+/− mice develop fulminant MC. B) H&E of cardiac tissue from a healthy wild type mouse and a Pdcd1−/−Ctla4+/− mouse with MC. Scale bar represents 200μm. Representative of n=10 animals per genotype. C) Dimensionality reduction with UMAP of scRNAseq on sorted CD45+ immune cells from control wild type mouse hearts (n=6) compared to hearts (n=4) of Pdcd1−/−Ctla4+/− mice with MC (n= 2509 cells per genotype). Cell type annotations were assisted by singleR and are quantified on the right. D) UMAP is subset on cells with Cd3e expression >1.5 and presence of a TCR, and then clustered using the Louvain algorithm (n=1266 cells). The proportion of the control and MC T cells in each cluster is quantified on the right. E) Expression of key T cell identity genes Cd8a and Cd4 are shown for each T cell cluster. F) TCR density is a measure of how many of the 100 nearest neighbors share the same TCR α and β chain. TCR density is shown for each cluster and split by control or MC. G) Differential gene expression between cluster 0 T cells and all other T cell clusters (1,2,3, and 4). Higher expression in cluster 0 is indicated by positive fold change. Red indicates FDR-corrected p-value (q-value) <0.05. Black indicates not significant. h) Violin plots shown expression of key genes by clonality and sample. Clonal is defined as > 2 cells with the same TCR α and β chains. No clonal cells are seen in the control sample. Identity genes are light blue. Naïve T cells genes are dark blue. T cell activation genes are red.

