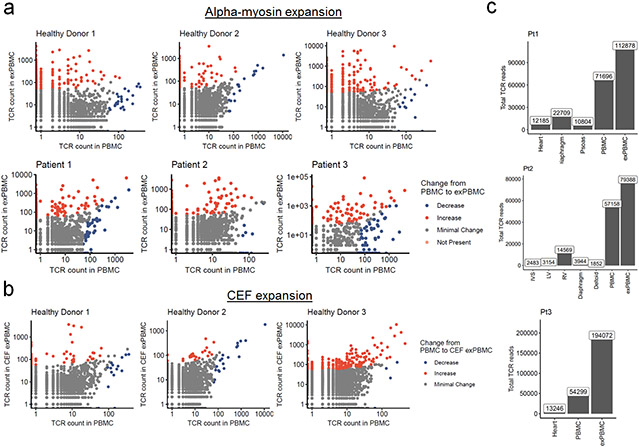
Extended Data Figure 6. TCR sequencing on exPBMC shows expansion of α-myosin and CEF specific TCRs.
a) Comparison of TCR beta chain abundance in α-myosin exPBMC and pre-expansion PBMC for all patients. Each plot is within the same patient only. Color represents change from PBMC to exPBMC. Minimal change is less than a 50 read count change. b) Comparison of TCR beta chain abundance in CEF exPBMC and pre-expansion PBMC for all healthy donors. Color represents change from PBMC to CEF exPBMC. Minimal change is less than a 50 read count change. c) Total TCR reads for biopsy (heart), autopsy, and PBMC samples from patients 1, 2 and 3.

