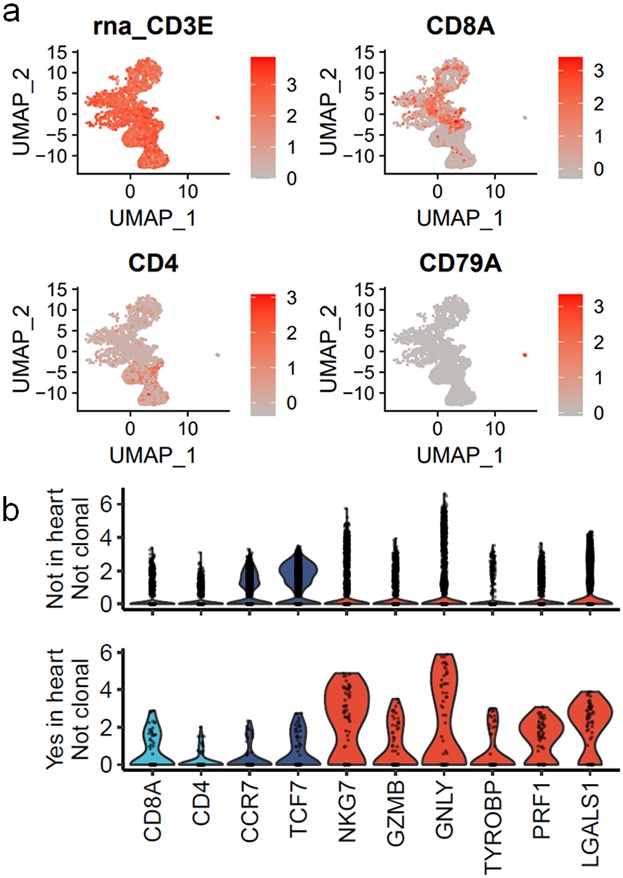
Extended Data Figure 8. Purity analysis for single cell sequencing on exPBMCs from patient 1.

a) Gene expression is shown on single cell sequencing of CD3 sorted exPBMCs from patient 1. b) Violin plots of key gene expression by presence or absence in cardiac TCR repertoire and clonality in exPBMC. Identity genes are shown in light blue. Genes associated with naïve T cells are shown in dark blue. Genes associated with T cell activation are shown in red.
