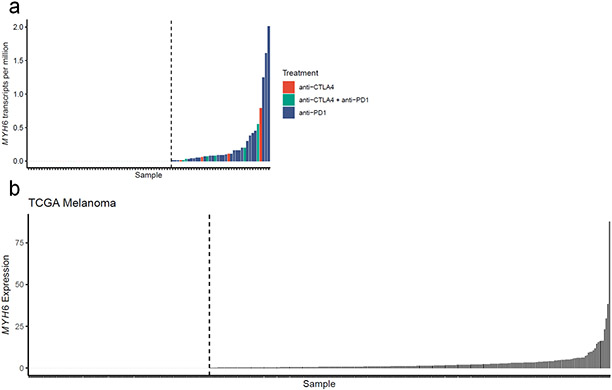
Extended Data Figure 10. Tumor-specific MYH6 expression.
a) MYH6 transcripts per million are shown for n=91 pre-treatment RNA-sequencing melanoma samples. Bars are colored by what ICI treatment the patient received. b) MYH6 expression is shown for n=363 melanoma samples accessed from TCGA. Samples to the right of the dotted lines have detectable MYH6 expression.

