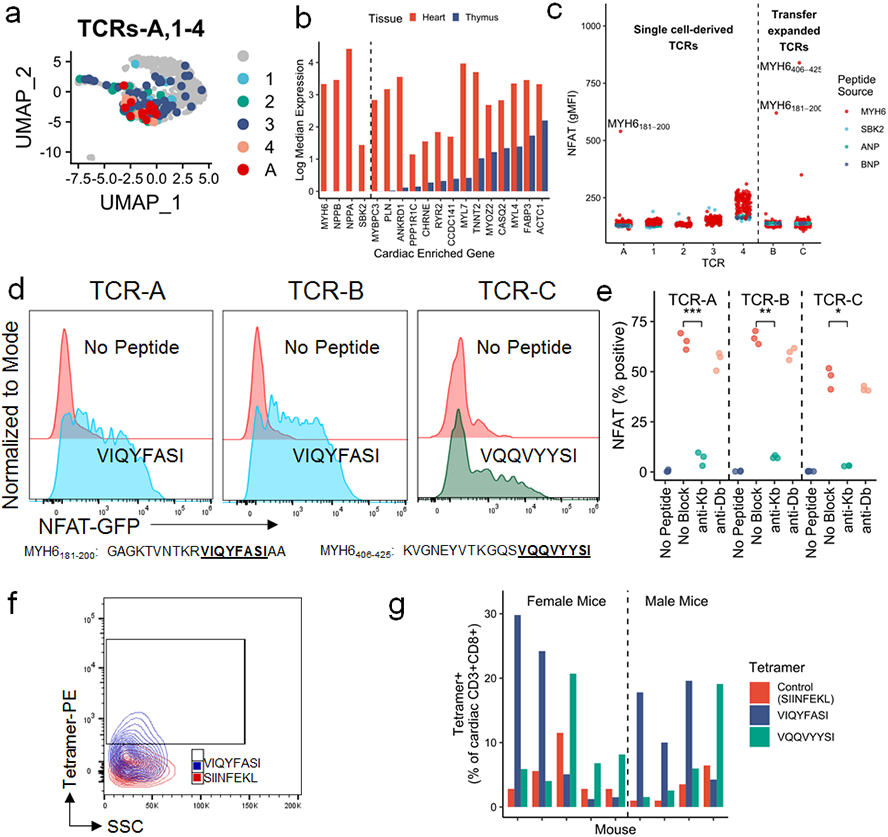
Figure 3. α-myosin is an MHC-I restricted autoantigen in murine MC.

A) TCRs-A, 1-4, used for antigen discovery, shown on the same plot as Fig. 1d. Grey cells do not express TCRs A or 1-4. b) Log median expression of 18 cardiac enriched genes in the heart (red) and thymus (blue). Genes to the left of the dashed line have no detectable expression in thymic APCs. c) NFAT-GFP reporter activity, measured by flow cytometry and shown as geometric mean fluorescence intensity, of all TCR cell lines stimulated independently with 172, 10-20aa SBK2, ANP, BNP, or α-myosin peptides. TCRs to the left of the dotted line are derived from single cell sequencing data (see Fig. 3a). TCRs to the right of the dotted line were selected due to expansion in adoptive transfer experiments (see Fig. 2e). TCRs named with letters (A-C) have a cognate antigen identified whereas TCRs named with numerals (1-4) do not have an identified cognate antigen. Top α-myosin peptide hits are labeled. d) Representative (of n=3 independent replicates) flow cytometry histograms of each TCR cell line co-cultured with BMDCs and stimulated with 10μg/mL predicted cognate peptide relative to no peptide. Peptide sequences are shown in the table. e) Each TCR cell line was co-cultured with EL-4 APCs and 10μg/mL cognate peptide (VIQYFASI for TCRs A and B; VQQVYYSI for TCR C; except for no peptide controls) with or without 10μg/mL of anti-Kb or anti-Db blocking antibody. NFAT-GFP reporter activity is shown as percent of live cells. n=3 biological replicates. P=0.00035 (TCR-A), p=0.004 (TCR-B), p=0.013 (TCR-C), two-sided t-tests for no block to anti-Kb, adjusted for multiple comparisons. f) Representative flow cytometry of SIINFEKL (red) and VIQYFASI (blue) loaded H2-Kb tetramer staining on cardiac CD3+CD8+ cells. g) Quantification of control, VIQYFASI, and VQQVYYSI H2-Kb-tetramer staining in cardiac CD3+CD8+ cells in individual mice. Each group of three bars represents one mouse with MC. n=9 mice (n=5 female; n=4 male).
