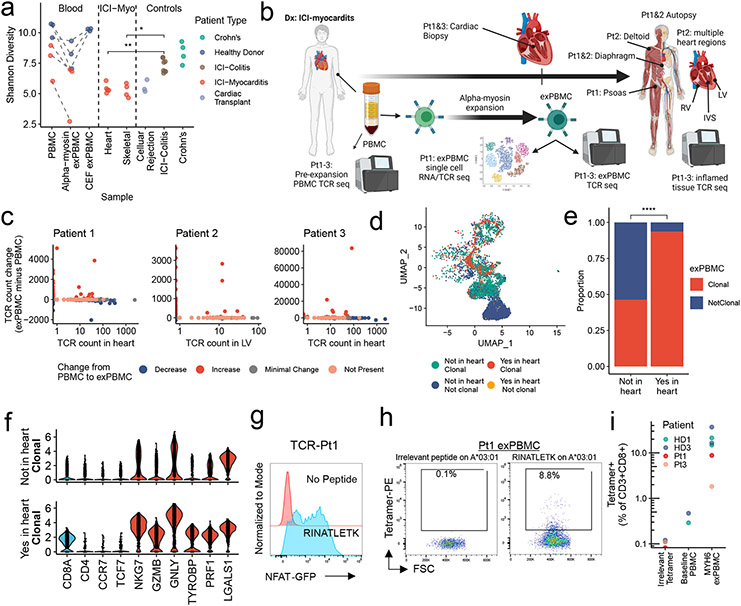
Figure 4. α-myosin expanded TCRs are present in cardiac and skeletal muscle of patients with ICI-MC.
a) Shannon diversity of TCR beta chain repertoires. Dashed lines connect blood samples within same donor. P-values represent two-sided Wilcoxon tests. n=6 PBMC, n= 6 α-myosin exPBMC, n=3 CEF exPBMC, n=5 heart from 3 patients (multiple regions for pt2), n=4 skeletal muscle from 2 patients, n=3 rejection from 3 cardiac transplant patients, n=8 ICI-colitis from 8 patients, n=4 Crohn’s from 4 patients. b) ICI-MC patient tissues. RV= right ventricle. LV = left ventricle. IVS = interventricular septum. c) Change in TCR counts from PBMC to α-myosin exPBMC plotted by abundance of the same TCR beta chain in the autologous inflamed cardiac tissue. Minimal change is less than a 50 read count change. Not present means not found in either PBMC or exPBMC. d) Dimensionality reduction with UMAP on scRNAseq of CD3+ patient 1 exPBMC. Groups are divided by whether the TCR beta chain expressed by that cell is present in the patient’s heart and whether that TCR is clonal (expressed by >2 cells in exPBMC). e) Proportion of single cell sequenced exPBMCs that are clonal, stratified by whether that TCR is present in the heart. P<0.0001 by two-sided Fisher’s Exact test. f) Violin plots of key genes by presence or absence in heart and clonality in exPBMC. Identity genes are light blue. Naïve genes are dark blue. Activation genes are red. g) Flow cytometry histogram of TCR-Pt1 reporter cell line co-cultured with autologous LCLs and stimulated with 10μg/mL RINATLETK peptide relative to no peptide. (n=3 replicates) h) Scatter plot showing CD3+CD8+ Pt1 exPBMC stained with irrelevant peptide or RINATLETK on HLA-A:03*01 tetramer. i) Quantification of RINATLETK on HLA-A:03*01 tetramer staining across samples, compared to irrelevant peptide. n=2 healthy donors for baseline PBMC. n=6 exPBMC (1 replicate for 2 ICI-MC patients and 2 replicates for 2 healthy donors).

