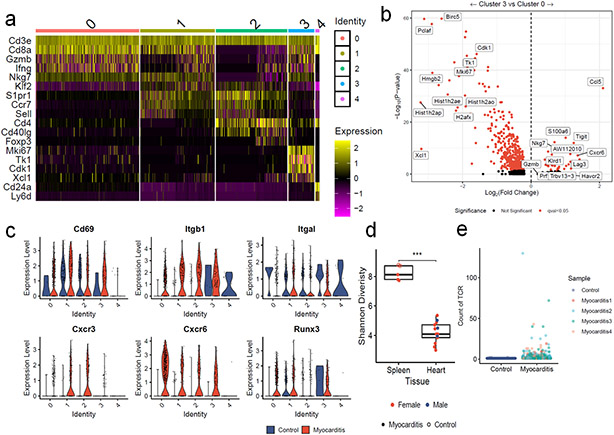
Extended Data Figure 3. T cells in MC are effector or proliferating, tissue-resident and clonal.
a) Expression of key T cell genes by cluster in single cell data. b) Differential gene expression for Cluster 0 vs. Cluster 3 T cells. Red indicates FDR-corrected p-value (q-value) <0.05. Black indicates not significant. c) Violin plots show expression of key tissue residency associated genes by cluster and MC vs. control. d) Shannon diversity on bulk TCR sequencing beta chain repertoires. Color indicates sex. Shape indicates whether the tissue was derived from a control wild type mouse (open circle) or a Pdcd1−/−Ctla4+/− mouse with MC (filled circle). P=0.0002, two-sided Wilcoxon test. Box plots show the median, first and third quartiles. The whiskers extend to the maxima and minima but no further than 1.5 times the inter-quartile range. e) TCR counts in single cell data. MC sample is divided by mouse of origin. Clonal TCRs are found in all 4 sequenced hearts.

