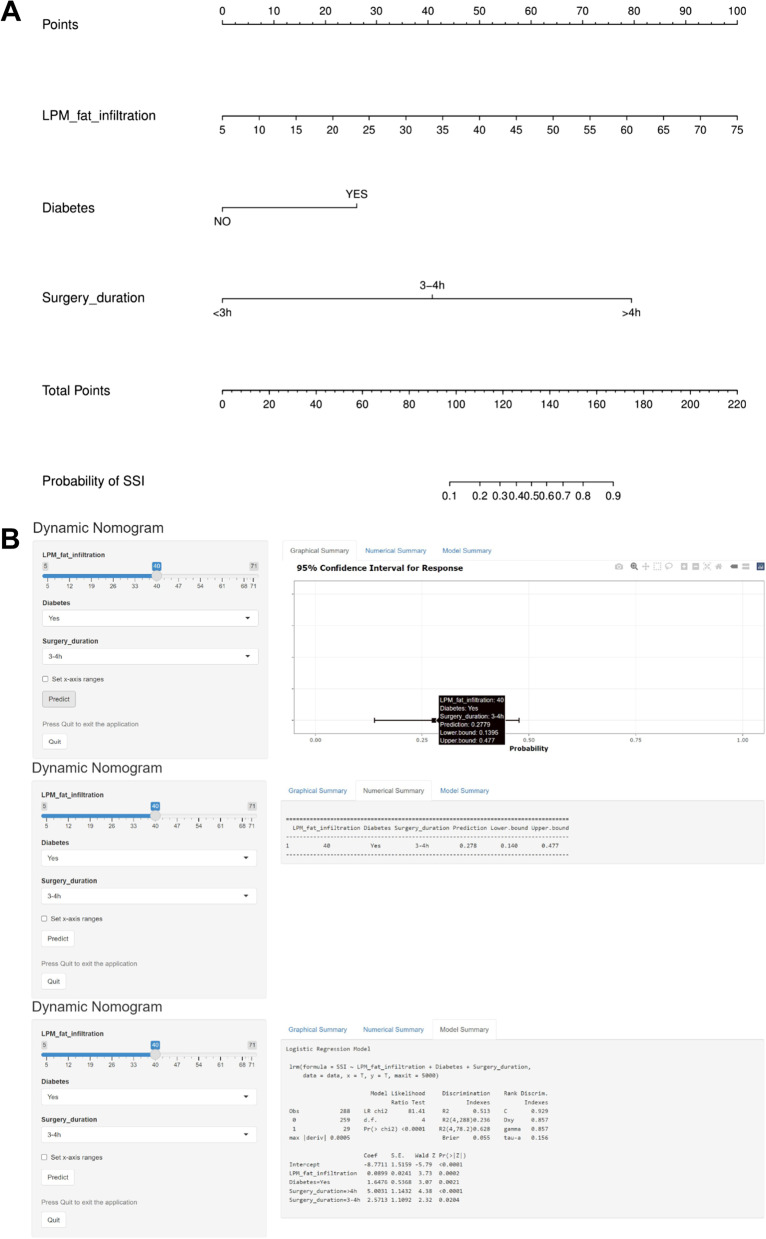
Fig. 3.
A nomogram predicting the risk of SSI within 1 month after TLIF. A The use of the nomogram is as follows: All variables of the patient (including LPM fat infiltration, surgery duration and diabetes) can obtain corresponding scores on the nomogram point axis. Add the corresponding scores of all variables to get the total score. The total score of each patient can be obtained through the corresponding relationship between the total score axis (score) and the SSI risk axis (%) to obtain the specific probability of SSI occurrence. B An online calculator converted from a nomogram is used to generate numerical predictions of the probability of SSI after TLIF (https://dynomogramrsci.shinyapps.io/DynNomSSI/)

