Figure 3.
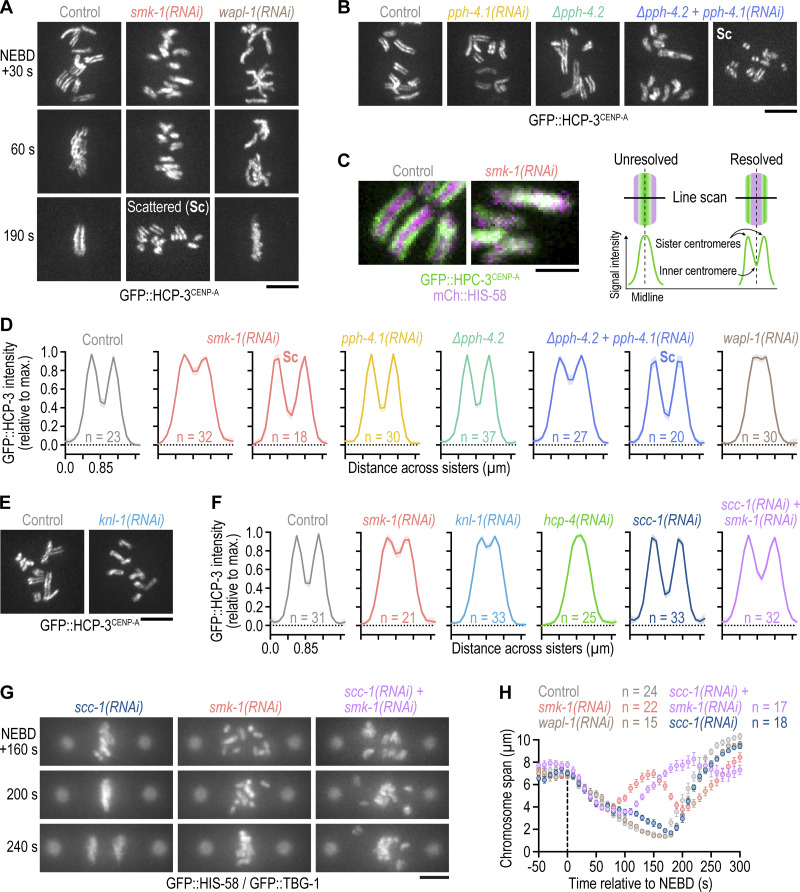
Delayed outer kinetochore assembly following PP4 inhibition also delays sister centromere resolution. (A and B) Selected images from time-lapse movies of one-cell embryos expressing endogenously tagged GFP::CENP-A (HCP-3) to mark sister centromeres. Time in A is relative to NEBD. Time point in B corresponds to 30 s after NEBD. For ∆pph-4.2 + pph-4.1(RNAi), the time of chromosome scattering (Sc) is also shown. Scale bars, 5 µm. (C) Left: Selected images from time-lapse movies of one-cell embryos co-expressing endogenously tagged GFP::HCP-3 and transgenic mCherry::histone H2B (HIS-58). Time point corresponds to 30 s after NEBD. Scale bar, 2 µm. Right: Schematic illustrating how line scans of the GFP::HCP-3 signal across the short axis of condensed mitotic chromosomes report on the extent of sister centromere resolution. (D and F) Line scan profiles (mean of n chromosomes from at least 10 embryos ± 95% CI), generated as described in C. Profiles in D are of endogenously tagged GFP::HCP-3, and profiles in F are of transgenic GFP::HCP-3 in an hcp-3 knock-out background. Also see Fig. S2 E. (E) Selected images from time-lapse movies of one-cell embryos expressing transgenic GFP::HCP-3. Time point corresponds to 30 s after NEBD. Scale bar, 5 µm. (G) Selected images from time-lapse movies of one-cell embryos co-expressing GFP::histone H2B (HIS-58) and GFP::γ-tubulin (TBG-1). Time is relative to NEBD. Scale bar, 5 µm. (H) Chromosome span (mean of n embryos ± SEM) versus time relative to NEBD. Measurements were performed in embryos such as those shown in G.

