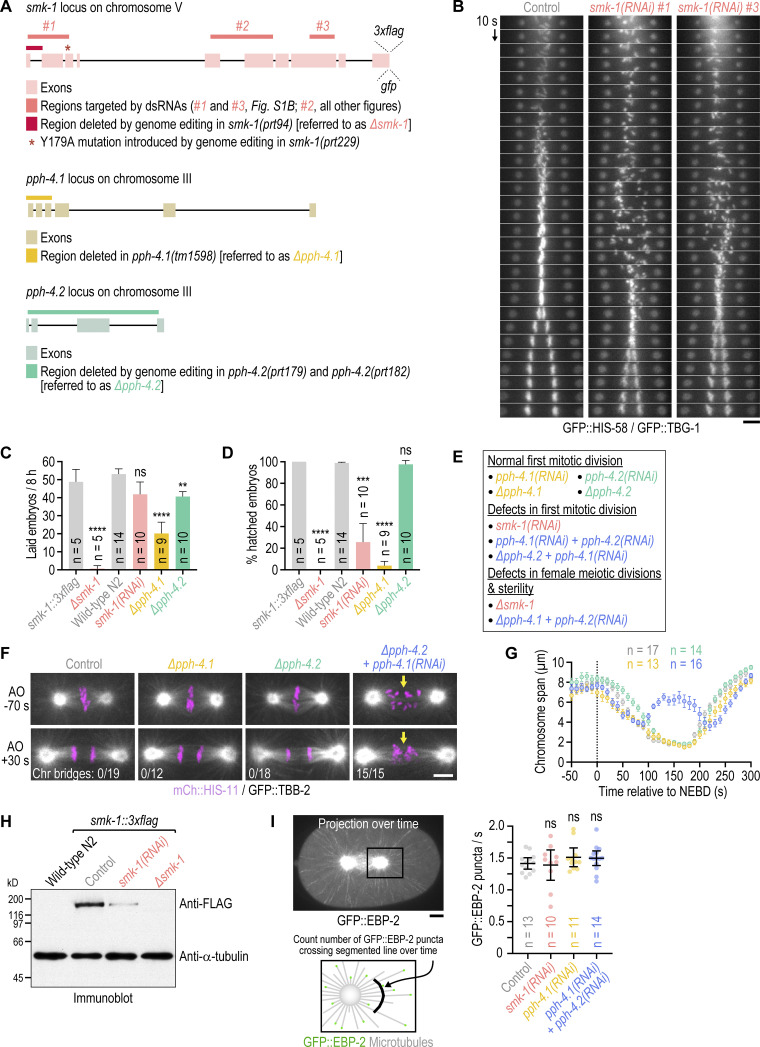
Figure S1.
Additional characterization of PP4 inhibition. (A) Genomic loci of PP4 subunits with annotation of existing mutations (∆pph-4.1) and modifications introduced by genome-editing for this study (smk-1::3xflag, smk-1::gfp, ∆smk-1, smk-1(Y179A), ∆pph-4.2). The ∆smk-1 mutation was introduced into the smk-1::3xflag background, and the smk-1(Y179A) mutation was introduced into the smk-1::gfp background. Regions in smk-1 targeted by dsRNAs are also indicated. (B) Time-aligned kymographs generated from time-lapse movies of one-cell embryos co-expressing GFP::histone H2B (HIS-58) and GFP::γ-tubulin (TBG-1). Of the three dsRNAs described in A, #1 and #3 were used here, and #2 was used for all other experiments. Scale bar, 5 µm. (C and D) Number of embryo progeny laid by a single mother in an 8-h interval (C), and embryonic viability (D), plotted as the percentage of hatched embryo progeny from a single mother (mean of n mothers ± 95% CI). Mothers were homozygous for the mutations analyzed. The smk-1::3xflag strain serves as the control for ∆smk-1, and the wild-type N2 strain serves as the control for the other conditions. Statistical significance (control versus perturbations) was determined by ANOVA on ranks (Kruskal-Wallis nonparametric test) followed by Dunn's multiple comparison test. ****P < 0.0001; ***P < 0.001; **P < 0.01; ns = not significant, P > 0.05. (E) Summary of the effect of different PP4 inhibition conditions on chromosome segregation in embryonic mitosis and female meiosis. Homozygous ∆smk-1 animals and homozygous ∆pph-4.1 animals injected with dsRNA against pph-4.2 only produce a few embryos before becoming sterile and could therefore not be used to characterize mitotic PP4 function. (F) Selected images from time-lapse movies of one-cell embryos co-expressing mCherry::histone H2B (HIS-11) and GFP::β-tubulin (TBB-2). Time is relative to anaphase onset (AO). Arrows highlight defective chromosome congression and segregation in PP4-inhibited embryos. The number of anaphases with chromatin (chr) bridges relative to the total number of anaphases examined is indicated. Scale bar, 5 µm. (G) Chromosome span (mean of n embryos ± SEM) versus time relative to NEBD, measured in one-cell embryos such as those shown in F. Conditions are color-coded as in F. (H) Anti-FLAG immunoblot of adult animals, showing expression levels of endogenous 3xFLAG-tagged SMK-1, the absence of SMK-1::3xFLAG signal in the null mutant ∆smk-1, and residual SMK-1::3xFLAG signal after RNAi-mediated depletion. Anti-α-tubulin antibody serves as the loading control. Molecular weight is indicated in kilodaltons (kD). (I) Top left: Maximum intensity projection over successive frames from a time-lapse movie of a one-cell embryo expressing the microtubule plus-end marker GFP::EBP-2. Scale bar, 5 µm. Bottom left: Schematic illustrating the assay for quantification of microtubule nucleation rate. Right: Rate at which GFP::EBP-2 particles cross a segmented line near centrosomes (mean of n embryos ± 95% CI) as a measure of microtubule nucleation rate. Statistical significance (control versus perturbations) was determined by ANOVA on ranks (Kruskal-Wallis nonparametric test) followed by Dunn’s multiple comparison test. ns = not significant, P > 0.05.

