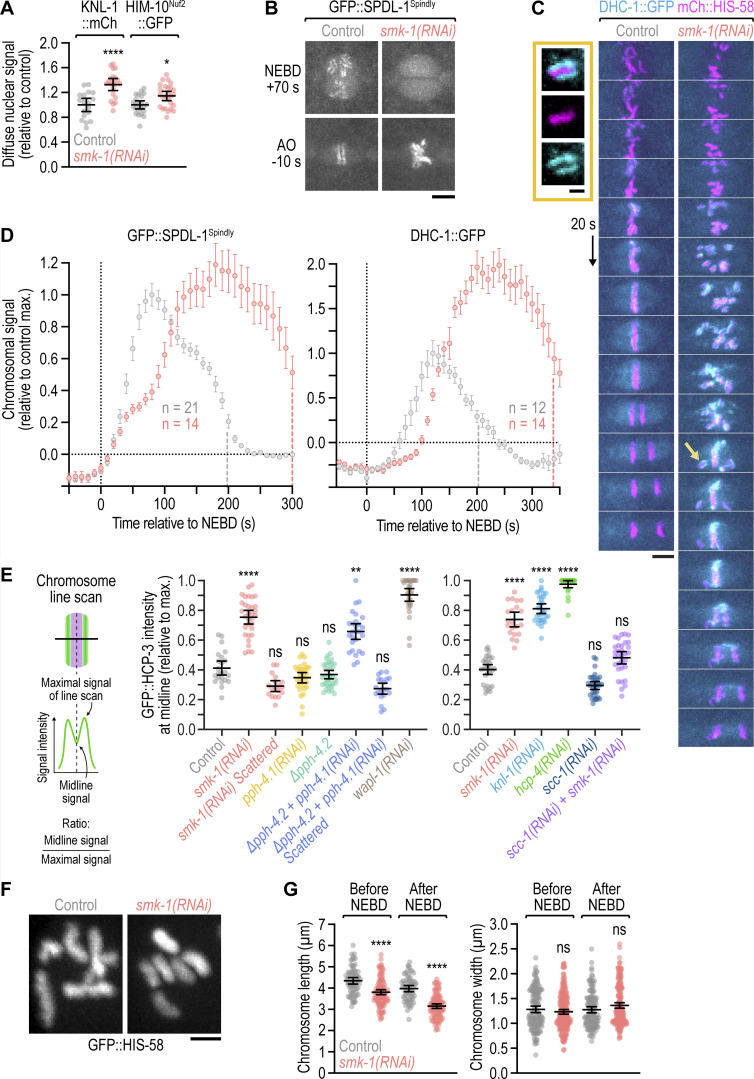
Figure S2.
Nuclear import of outer kinetochore components is unaffected by PP4 inhibition; the outermost kinetochore component dynein hyperaccumulates in late prometaphase following PP4 inhibition; quantification of the sister centromere resolution defects shown in Fig. 3; mitotic chromosomes have a compact morphology following PP4 inhibition. (A) Intensity of the non-chromosomal (diffuse) nuclear signal of fluorescently tagged outer kinetochore components at NEBD in the one-cell embryo (mean ± 95% CI), normalized to the mean of the respective control. Statistical significance (control versus smk-1(RNAi)) was determined by the Mann-Whitney test. ****P < 0.0001; *P < 0.05. (B) Selected images from time-lapse movies of one-cell embryos co-expressing transgenic GFP::SPDL-1 in a spdl-1 knock-out background and transgenic mCherry::histone H2B (HIS-58). Only the GFP::SPDL-1 signal is shown. AO, anaphase onset. Scale bar, 5 µm. (C) Selected images from time-lapse movies of one-cell embryos co-expressing endogenously GFP-tagged dynein heavy chain (DHC-1) and transgenic mCherry::histone H2B (HIS-58). Image sequences start at the same time point after NEBD. Arrow points to the unaligned chromosome shown at greater magnification. Scale bar, 5 µm; magnified chromosome, 2 µm. (D) Intensity of chromosomal GFP::SPDL-1 (left) and DHC-1::GFP (right) signal (mean of n embryos ± SEM) versus time relative to NEBD, determined by averaging the signal of the top 15 local maxima detected on chromosomes in time-lapse movies of one-cell embryos. Traces are normalized to the peak signal in the control. Vertical dashed lines mark the average time of anaphase onset. (E) Quantification of the line scans shown in Fig. 3, D and F (left and right graph, respectively). GFP::CENP-A (HCP-3) signal intensity at the chromosome midline relative to the maximal signal intensity in the line scan (mean of n chromosomes from at least 10 embryos ± 95% CI) was determined as illustrated in the schematic. Statistical significance (control versus perturbations) was determined by ANOVA on ranks (Kruskal-Wallis nonparametric test) followed by Dunn's multiple comparison test. ****P < 0.0001; **P < 0.01; ns = not significant, P > 0.05. (F) Morphology of early prometaphase chromosomes in one-cell embryos, marked by transgenic GFP::histone H2B (HIS-58). Scale bar, 2 µm. (G) Length and width of mitotic chromosomes in late prophase and early prometaphase (mean ± 95% CI), derived from 3D measurements in z-stacks acquired of GFP-marked chromosomes as shown in F. Data points correspond to values of individual chromosomes from at least 5 embryos per condition, normalized to the mean of the control. Statistical significance (control versus smk-1(RNAi)) was determined by the Mann-Whitney test. ****P < 0.0001; ns = not significant, P > 0.05.

