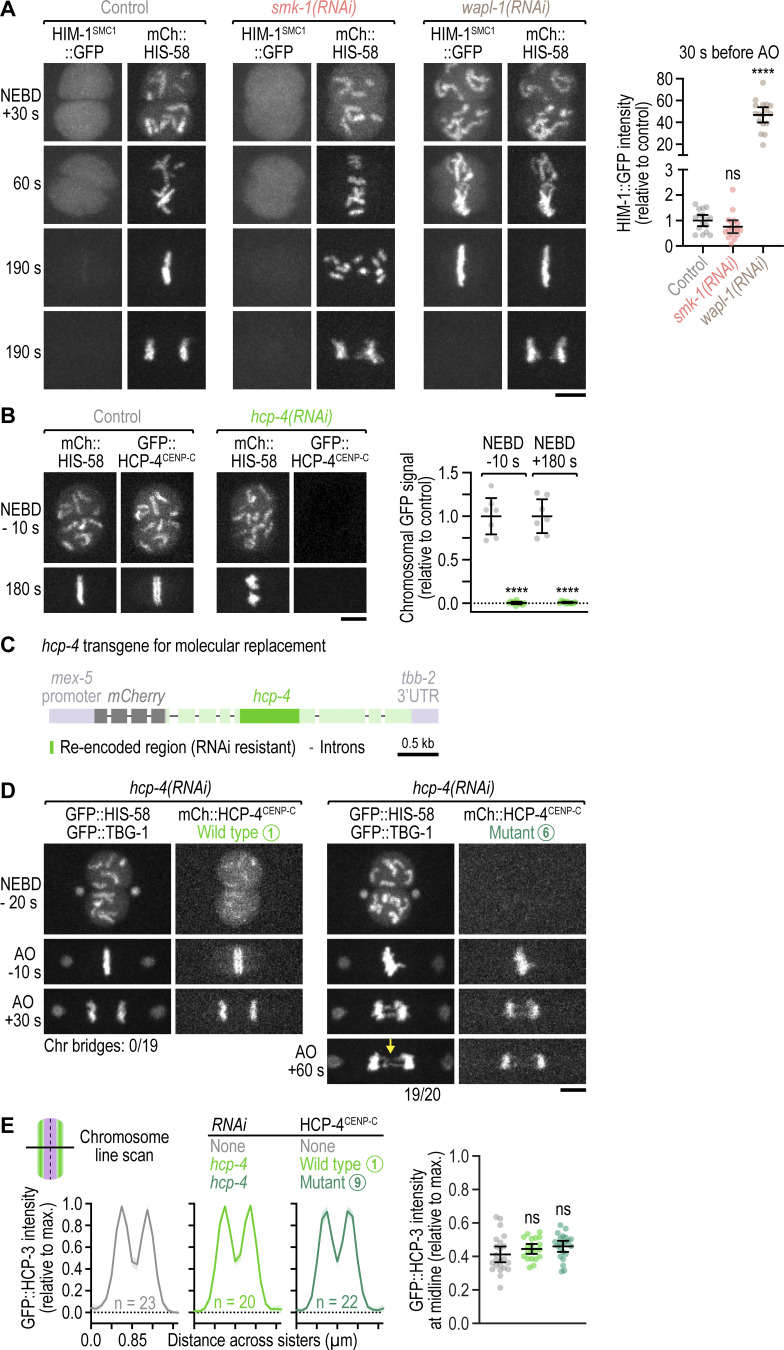
Figure S3.
Mitotic chromosomes do not exhibit defects in cohesin removal following PP4 inhibition; hcp-4(RNAi) for molecular replacement is penetrant; the HCP-4(F438A) mutation prevents nuclear import of HCP-4; the SMK-1–HCP-4 interaction is dispensable for sister centromere resolution. (A) Left: Selected images from time-lapse movies of one-cell embryos co-expressing endogenously tagged HIM-1::GFP (the SMC1 subunit of the cohesin complex) and transgenic mCherry::histone H2B (HIS-58). Time is relative to NEBD. Scale bar, 5 µm. Right: Integrated intensity of chromosomal HIM-1::GFP signal (mean ± 95% CI) three frames before anaphase onset (AO) in the one-cell embryo, normalized to the mean of the control. Signal was measured in embryos such as those shown in A. Statistical significance (control versus perturbations) was determined by ANOVA on ranks (Kruskal-Wallis nonparametric test) followed by Dunn’s multiple comparison test. ****P < 0.0001; ns = not significant, P > 0.05. (B) Left: Selected images from time-lapse movies of one-cell embryos co-expressing endogenously tagged GFP::CENP-C (HCP-4) and transgenic mCherry::histone H2B (HIS-58). Time is relative to NEBD. Scale bar, 5 µm. Right: Integrated intensity of chromosomal GFP::HCP-4 signal (mean ± 95% CI) before NEBD and at metaphase in the one-cell embryo, normalized to the mean of the control. Signal was measured in embryos such as those shown on the left. Statistical significance (control versus smk-1(RNAi)) was determined by the Mann-Whitney test. ****P <0.0001. The dsRNA targets the region of hcp-4 that is re-encoded in the RNAi-resistant transgene. (C) Schematic of the mCherry-tagged RNAi-resistant hcp-4 transgene used for molecular replacement experiments in one-cell embryos. (D) Selected images from time-lapse movies of one-cell embryos co-expressing RNAi-resistant transgenic mCherry::HCP-4, transgenic GFP::histone H2B (HIS-58), and transgenic GFP::γ-tubulin (TBG-1). Time is relative to NEBD or anaphase onset (AO). The HCP-4 mutant corresponds to mutant number 6 in Fig. 4 B, which fails to localize to the prophase nucleus but is recruited to chromosomes after NEBD. A comparison with other FxxP motif mutants shows that the effect is attributable to the F438A mutation. Arrow points to defective chromosome segregation in the mutant. The number of anaphases with chromatin (chr) bridges relative to the total number of anaphases examined is indicated. Scale bar, 5 µm. (E) Left: Line scan profiles (mean of n chromosomes from at least 10 embryos ± 95% CI), generated as described in Fig. 3 C. Right: Ratio of GFP::CENP-A (HCP-3) signal intensity at the midline of condensed chromosomes to the maximal signal intensity in the line scan (mean of n chromosomes from at least 10 embryos ± 95% CI), determined as described in Fig. S2 E. Statistical significance (control versus perturbations) was determined by ANOVA on ranks (Kruskal-Wallis nonparametric test) followed by Dunn's multiple comparison test. ns = not significant, P > 0.05. The HCP-4 mutant corresponds to mutant number 9 in Fig. 4 B.

