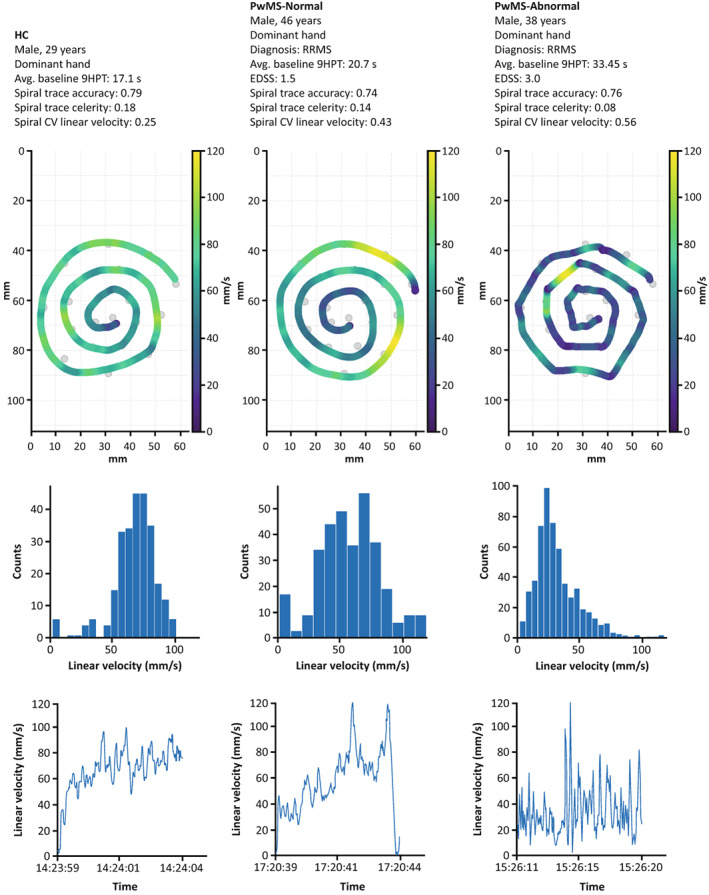
Figure 4.

Increased variability in spiral linear velocity with higher levels of MS‐related impairment. The top row shows the drawn traces of the spiral shape for an HC (left), a PwMS‐Normal (middle), and a PwMS‐Abnormal (right), with the color bar indicating the linear velocity. The corresponding histograms and time series of the spiral linear velocity are shown in the middle and bottom rows. The x‐axis in the bottom row displays the time of day (h:min:sec). 9HPT, Nine‐Hole Peg Test; avg., average; CV, coefficient of variation; EDSS, Expanded Disability Status Scale; HC, healthy control; MS, multiple sclerosis; PwMS, people with multiple sclerosis; RRMS, relapsing–remitting multiple sclerosis; s, seconds.
