
Figure 5. Neutralizing antibody C9 crosslinks spikes at the cell surface and induces coalescence of spike-C9 complexes.
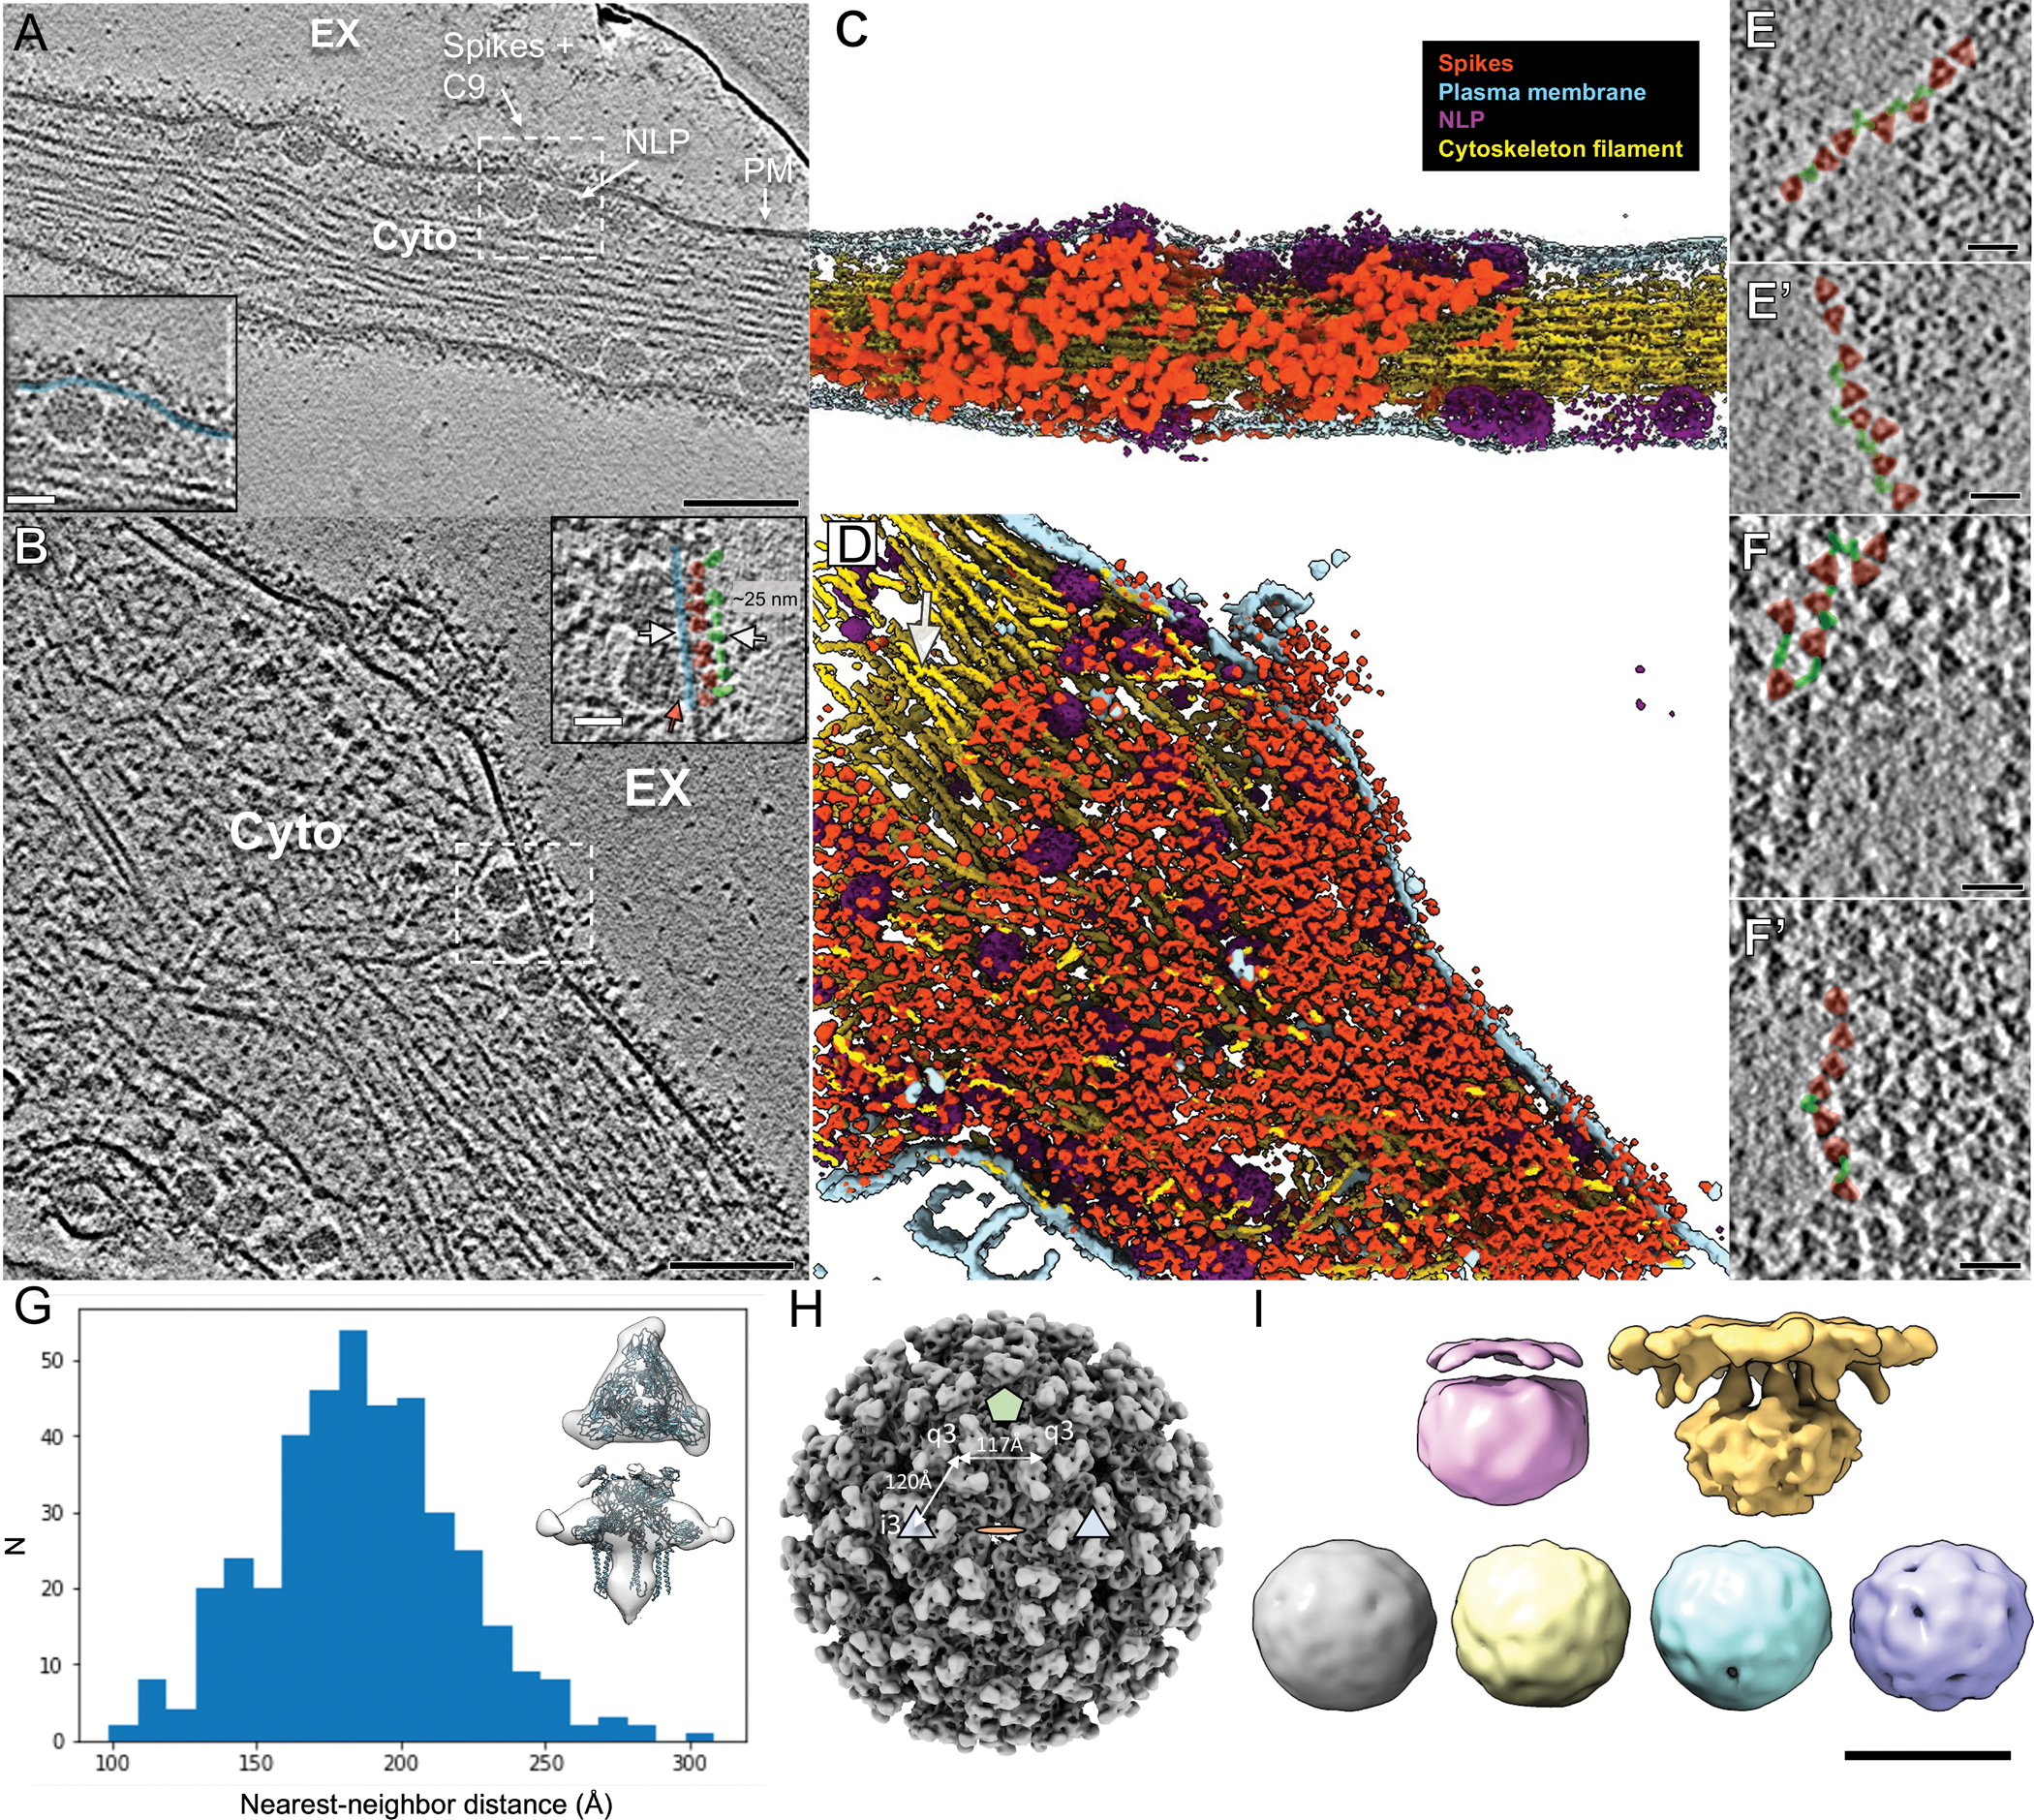
(A-B) Individual slices of Volta phase plate cryoET tomograms displaying CHIKV-infected cells treated with NAb C9 revealed arrested NLPs at the PM inner leaflet and dense, coalesced spike-C9 complexes on the PM outer leaflet (inset images: docked NLPs interacting with spike intracellular tails (red arrow) at the PM inner leaflet (blue), with spike ectodomains (pink) bound to NAb C9 (green) outside the cell. Scale bars, 100nm. Inset images scale bars, 25nm. EX-extracellular, Cyto-cytosol. (C-D) Corresponding 3D cellular annotations of tomograms (A-B), with trimeric spikes (orange-red), PM (light blue), NLPs (purple) and cytoskeleton filaments (gold) colored. (E, E’, F, F’) Zoomed-in top views of envelope spikes (orange-red) embedded at the PM with C9 (green) intercalating trimeric spikes. Spikes with bridging C9 density (green) often arranged with clear, near-linear boundaries. Scale bars 25 nm. (G) Subvolume average of C9-linked trimeric spikes and plot of distance between spike and nearest neighbor after refinement of orientation for each extracted spike subvolume in representative tomogram. Low-resolution subvolume spike average shows general agreement with the CHIKV spike atomic model (PDB:3J0C). (H) Distances on the virus particle between icosahedral-3-fold (i3) spikes and quasi-3-fold spikes (q3), as well as q3-q3 spikes, displayed on the virus particle with icosahedral 2-fold (orange disc), 3-fold (blue triangle) and 5-fold (green penton) for reference. (I) Subtomogram class averages of NLPs within the cytoplasm of C9-treated cells. Two classes (top) display reorganization at the membrane-proximal end while other four class averages (bottom) are roughly spherical and lack icosahedral symmetry. Docking end of egress-blocked NLPs is flattened in comparison to cytosolic NLP.