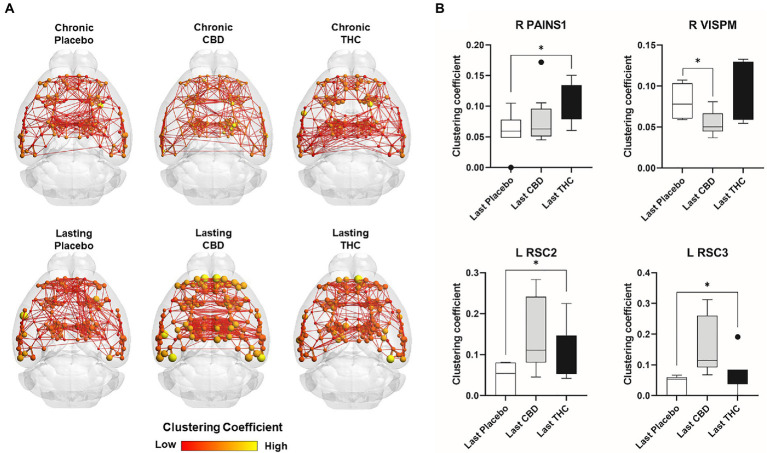
Figure 10.
Regional differences in clustering. Regional differences in clustering coefficient following chronic placebo, CBD, or Δ9-THC over 28 days (chronic) and after a 2-week washout period (lasting). (A) Connectome maps of a mouse functional network highlighting mean clustering coefficient across groups. Spheres represent scaled area under the curve (AUC) values for clustering coefficient calculated over several edge density thresholds (2–40%). Size and color intensity of spheres reflect high-to-low values (see scale bar). Lines between nodes represent pairwise connectivity between nodes (these are shown at edge density of 6% for visual clarity). (B) Clustering coefficient values for chronic treatment mice (calculated at a 16% edge density threshold). Clustering coefficient values for post-washout period (calculated at a 16% edge density threshold). Clustering coefficient values for post-washout period (calculated at a 16% edge density threshold). Data are shown as mean ± standard error (two-way ANOVA with repeated measures, post-hoc t-tests with FDR q = 0.05, p < 0.05). Abbreviations: R PAINS1, right posterior agranular insula node 1; R VISPM, right posteromedial visual cortex; L RSC2/3, Left retrosplenial cortex nodes 2 and 3.

