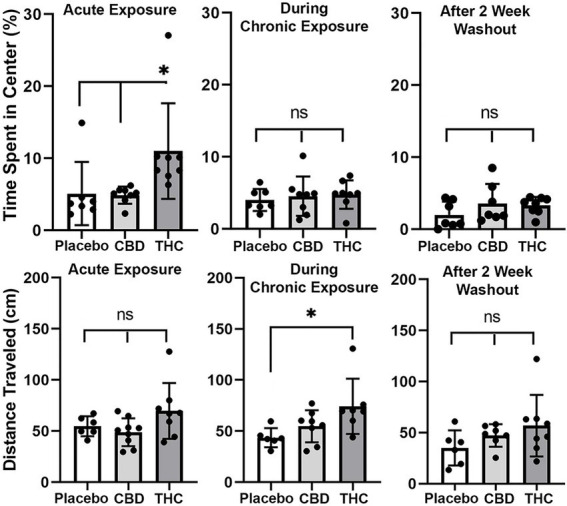
Figure 3.

Open field. The scatter plots above show the percentage of time spent in the center of the open field during first exposure (Acute Exposure) to inhaled cannabis high in CBD, Δ9-THC, or placebo and again at D26 of the 28 days of chronic exposure and following a two-week washout. Below is the distance traveled in the open field for each of the experimental conditions at each time point. The bar and line represent the mean and SD, respectively. (* p < 0.05).
