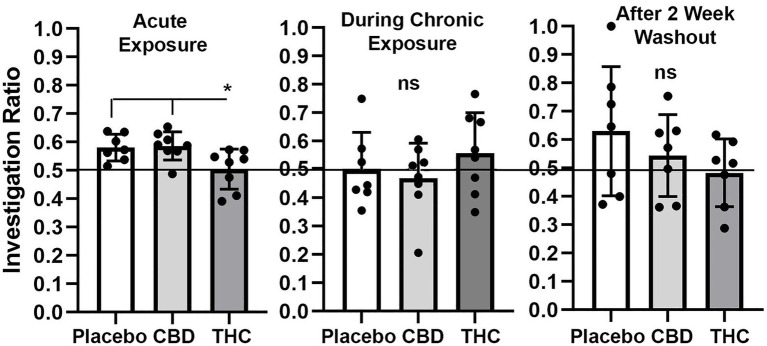
Figure 4.
Novel object recognition. Shown are scatter plots of the investigation ratio (time spent investigating the novel object / time spent investigating both objects) using single-sample, two-tailed t-tests, and performance was compared to chance (i.e., IR = 0.5) shown by the horizontal line. measurements were taken during first exposure to inhaled cannabis high in CBD, Δ9-THC, or placebo and again at D27 of the 28 days of chronic exposure and following a two-week washout. The bar and line represent the mean and SD, respectively. (* p < 0.05).

