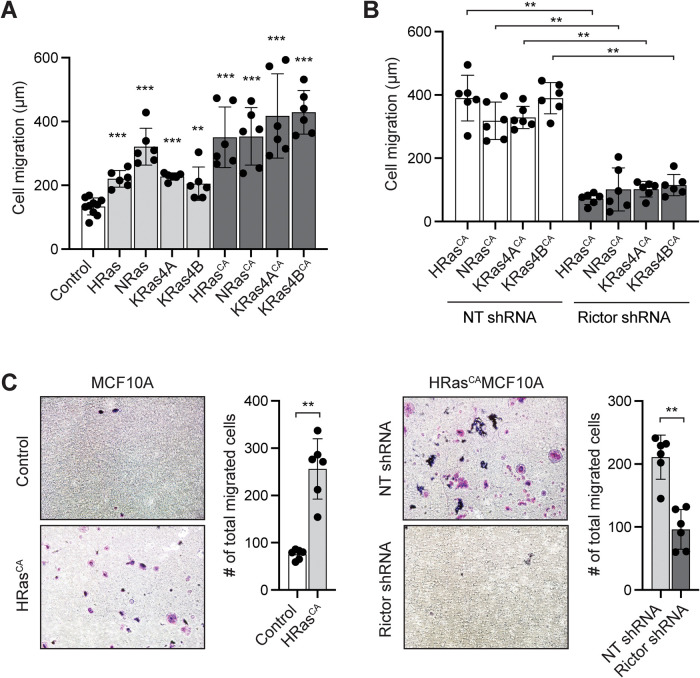
FIGURE 3:
Ras promotes the migration of MCF10A cells through mTORC2. (A) Wound closure cell migration assays of MCF10A cells expressing the indicated wild-type or constitutively active (CA; G12V mutation) Ras proteins, compared with control MCF10A cells transduced with empty vector. Data represent the measured migration distance ±SD of at least six wounds from at least three independent experiments. The statistics evaluate the difference in migration of Ras-expressing cells vs. the control. (B) Wound closure cell migration assays of MC10A cells expressing the indicated RasCA and treated with rictor shRNA or nontargeting (NT) shRNA control. Data represent the measured migration distance ±SD of at least six wounds from at least three independent experiments. (C) 3D cell migration transwell assay of HRasCA-expressing MCF10A cells compared with vector-transduced MCF10A cells, and HRasCA/MCF10A cells treated with rictor shRNA compared with NT shRNA. Representative images of crystal violet-stained cells that have migrated through the wells are shown (1 field of view of 13 areas analyzed and quantified). Graphs represent the total number of cells that have migrated through the entire well ±SD of six replicates performed in at least three independent experiments. **, p < 0.01; ***, p < 0.001.

