FIGURE 2:
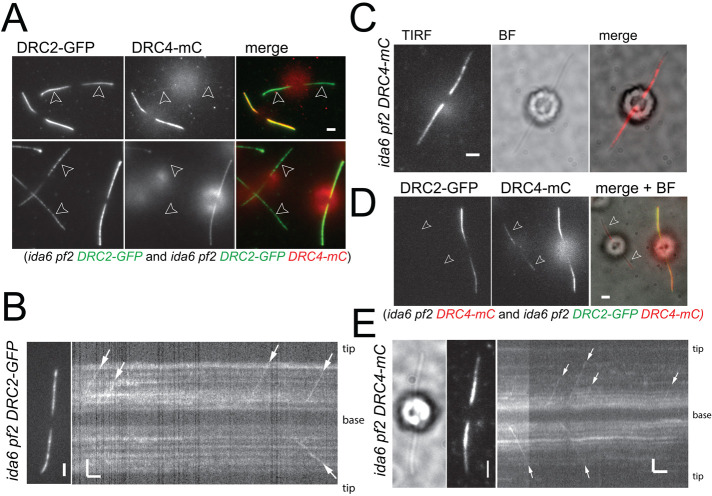
DRC2-GFP moves by IFT in the absence of DRC4 and vice versa. (A) Still images of ida6 pf2 DRC2-GFP and ida6 pf2 DRC2-GFP DRC4-mC cells. A mixture of the two strains was used to highlight the reduction of DRC2-GFP in the double mutant–single rescue strain with the pf2 mutation. Flagella are marked with arrowheads. Bar = 2 µm. (B) Still image and kymogram showing anterograde IFT of DRC2-GFP (white arrows) in the single rescue strain (ida6 pf2 DRC2-GFP). Bars = 2 s and 2 μm. (C) TIRF, bright field (BF), and merged image of an ida6 pf2 DRC4-mC cell. Bar = 2 μm. Note that the DRC4-mC signal tappers off toward the flagellar tip in the ida6 background. Bar = 2 µm. (D) Still images of ida6 pf2 DRC4-mC and ida6 pf2 DRC2-GFP DRC4-mC cells. Shown are the GFP image, the mC image, and a merge of the two channels with the bright field (BF) image. Note the reduction of the DRC4-mC signal in the double mutant–single rescue strain. Flagella are marked with arrowheads. Bar = 2 μm. (E) Bright field (BF) and TIRF images and the corresponding kymogram showing IFT of DRC4-mC transport in ida6 pf2 DRC4-mC (white arrows). Bars = 2 s and 2 μm.

