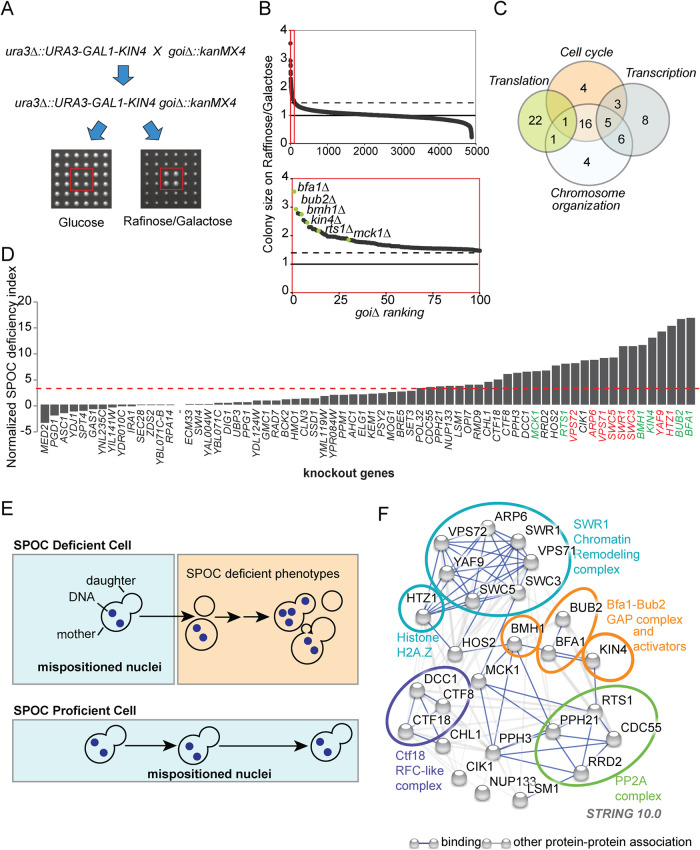
FIGURE 1:
Gene deletions that impair SPOC integrity. (A) Schematic representation of the SGA-based genetic screen strategy. In addition to the wild-type KIN4, the query strain carried a construct inserted in the URA3 locus for conditional KIN4 overexpression from the galactose-inducible promoter (ura3∆::URA3-GAL1-KIN4). The query strain was mated to a sporulated heterozygous diploid knockout library (goi∆::kanMX4) in which each library strain had four technical replicates spotted next to each other (2 × 2). Obtained diploids were spotted on haploid selection plates and the haploids carrying both the ura3∆::URA3-GAL1-KIN4 and the corresponding gene deletion from the library (goi∆::kanMX4) were selected. These double mutants (ura3∆::URA3-GAL1-KIN4 goi∆::kanMX4) were replicated on two types of plates with different carbon sources: glucose (no KIN4 overexpression) and raffinose/galactose (KIN4 overexpression). Plates were photographed, and colony sizes were measured in both plates to find colonies that grow under KIN4 overexpressing conditions. An example of a gene deletion with the desired phenotype is marked with a red box. (B) Plot showing colony sizes of ura3∆::URA3-GAL1-KIN4 goi∆::kanMX4. Knockout strains were ranked from better growing to poorly growing (goi∆ ranking from 1 to 4852, where goi∆ indicated the deletion of the corresponding gene of interest). The known SPOC proteins among the gene deletions with the top 100 highest colony sizes (red box) are marked in the magnification (lower plot). The dashed line indicates the threshold colony size value of 1.3, while a colony size of 1 is the median colony size on each plate. (C) Venn diagram showing the number of genes in indicated GO biological process categories. Remarkably, 70 among the top 100 hits of the screen fell into the indicated categories. (D) SPOC deficiency indexes of knockouts. Individual gene deletions were combined with the deletion of KAR9 to induce spindle misalignment. SPOC deficiency was assayed by microscopy of fixed cell populations after DNA staining; 100 cells were counted for knockout per experiment. The graph represents one of two independent experiments. The individual data values of the independent experiments are shown in Supplemental Table S2. The SPOC deficiency index of the kar9∆ was normalized to zero. Strains were considered SPOC deficient if the SPOC deficiency index was greater than 3.5 (marked by the red dashed line that is two SDs of unnormalized kar9∆ SPOC deficiency index above zero SPOC deficiency). Each bar represents a different gene deletion. Cells with normal aligned, misaligned nuclei as well as the cells with SPOC-deficient phenotypes (as depicted in E) were counted. Deletions of the known SPOC components are highlighted in green, whereas components of the SWR1-C found in the screen are highlighted in red. (E) Schematic representation of SPOC deficiency. A SPOC-deficient cell with a mispositioned anaphase spindle (indicated by two separated DNA regions in the mother cell compartment) exits mitosis and undergoes cytokinesis giving rise to cells with multiple nuclei and no nucleus. Further divisions of the same cell increase the multiple nuclei phenotype and also cause multibudded phenotypes (upper panel). SPOC-proficient cells, on the other hand, neither exit mitosis nor undergo cytokinesis as long as the spindle stays mispositioned (bottom panel). (F) Genetic and physical interactions between the proteins found to be involved in SPOC (based on experimental sources in string database). Disconnected nodes were removed. The ovals encircle the proteins that belong to the same protein complex.

