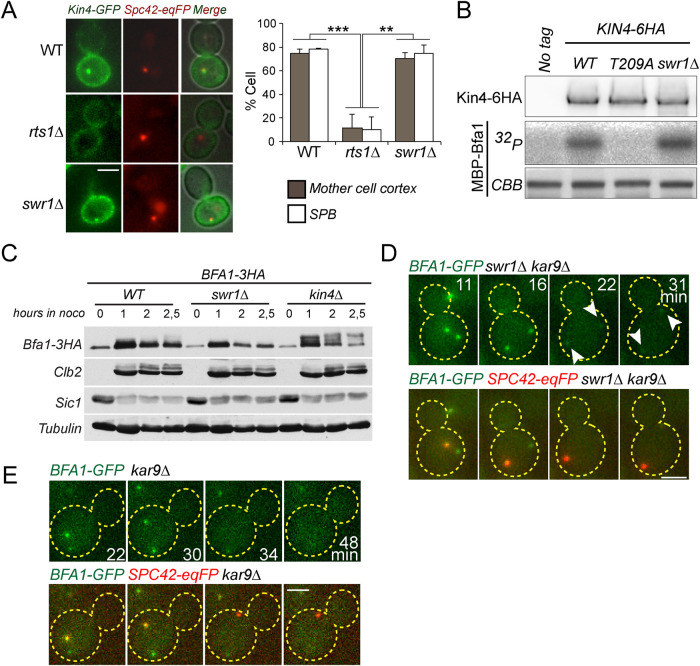
FIGURE 4:
Bfa1 regulation by Kin4 is not altered in swr1∆ cells. (A) The percentage of cells with Kin4 localized at the SPBs and mother cell cortex in the indicated cell types. Cells were treated by nocodazole to induce Kin4 recruitment to SPBs. rts1∆ cells served as a control in which Kin4 SPB and cortex localization diminishes; 100 cells were counted per cell type. The graph is an average of three independent experiments. Error bars show SD. (B) In vitro kinase assay of Kin4-6HA and Kin4-T209A-6HA (kinase inactive mutant) enriched from yeast cells with or without SWR1. Purified, recombinant MBP-Bfa1 was used as a substrate. Autoradiograph (32P) shows the incorporation of γ32P-ATP to MBP-Bfa1. MBP-Bfa1 levels are shown in Coomassie Brilliant Blue staining. Levels of the Kin4-6HA used in the reaction are shown in the immunoblot using anti-HA antibodies. (C) Immunoblots showing Bfa1 phosphorylation profile in the indicated cell types. In the absence of Bfa1 phosphorylation by Kin4, Bfa1 appears as slow migrating Bfa1 forms in SDS–PAGE gels (Maekawa et al., 2007). Cultures of indicated strains were arrested in G1 by alpha factor treatment (t = 0) and released in nocodazole-containing medium. Samples were collected at the depicted time points and probed with the indicated antibodies. Clb2 and Sic1 served as markers for cell cycle progression. Tubulin served as a loading control. (D, E) Representative still images from time-lapse series of Bfa1-GFP localization during anaphase spindle misalignment. Spc42-eqFP served as a SPB marker. Cell boundaries are outlined with dashed lines. Arrows point the SPBs. Scale bar: 3 µm.

