FIGURE 7:
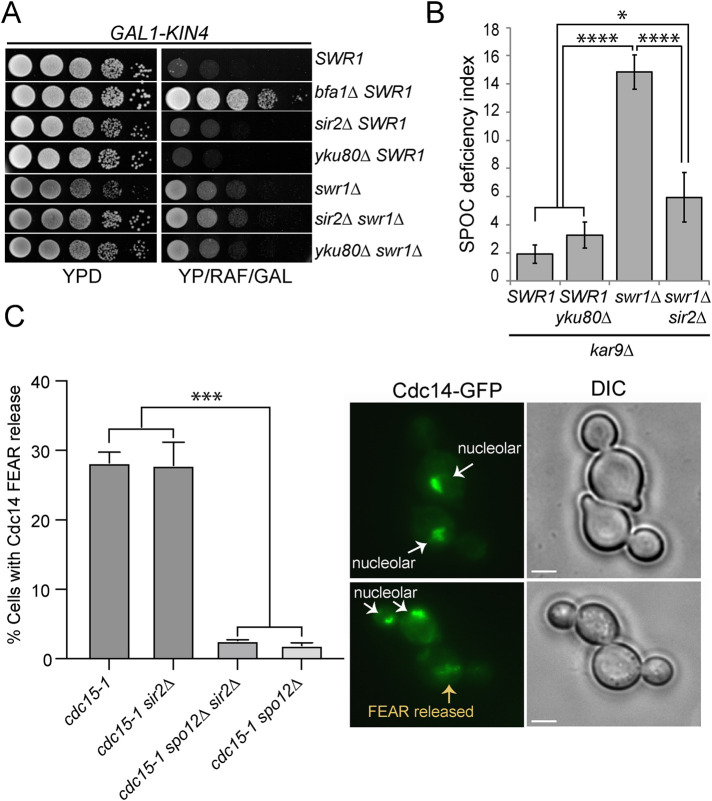
Sir2 contributes to SPOC deficiency of swr1∆ cells. (A) Serial dilutions of indicated strains were spotted on the agar plates that suppress (YPD) or induce (YP/RAF/GAL) KIN4 overexpression. (B) SPOC deficiency index of indicated strains. Graph shows an average of three independent experiments. A minimum of 100 cells were counted for each sample per experiment. Error bars are SD. (C) The percentage of cells with Cdc14-FEAR release. Indicated cell types were arrested in G1 using alpha factor at 23°C and released from the G1-block in alpha factor free medium at 37°C. Cells were collected every 30 min, fixed with PFA, and analyzed by microscopy. Cells with medium-to-large cells were scored based on Cdc14 nucleolar or FEAR released localization; spo12∆ cells served as a control for inactive FEAR. Scale bars: 3 µm. Graph shows an average of two experiments. A minimum of 100 cells were counted for each sample per experiment. Error bars are SD. One-way ANOVA test was performed for B and C. *p < 0.05, ***p < 0.001, ****p < 0.0001.

