FIGURE 8:
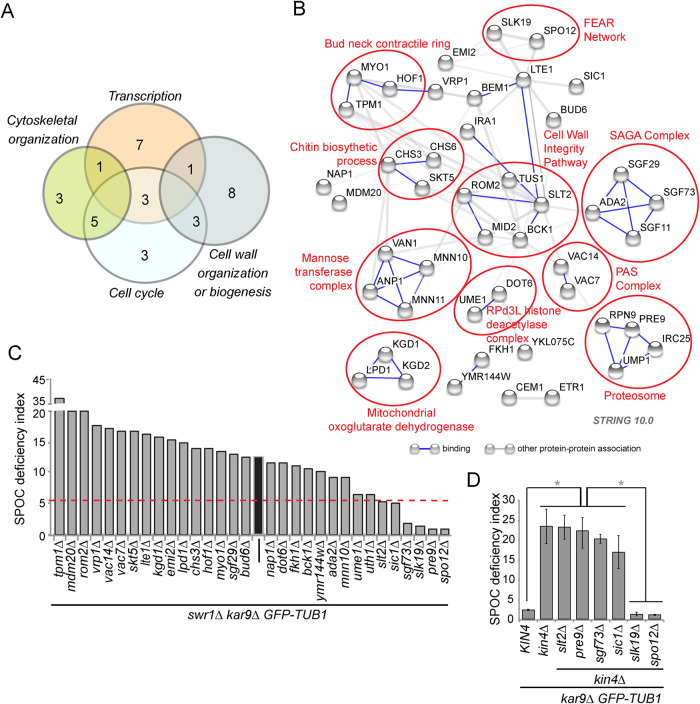
SGA screening identifies genes that are essential for the growth of swr1∆ GAL1-KIN4 cells under KIN4 overexpressing conditions. (A) Number of screen hits found within each of the indicated GO categories. (B) Physical and genetic interaction map of the hits. Circles indicate proteins with related functions. (C) Average SPOC deficiency indexes of the indicated strains. Values are an average of at least three independent experiments. Average values and SDs are listed in Data Set 6. A red line is placed at a SPOC deficiency index of 5.5, which is 2 SD below the average SPOC deficiency index of swr1∆ kar9∆. The average SPOC deficiency index of swr1∆ kar9∆ is marked with a black bar. (D) Average SPOC deficiency indexes of the indicated strains. Error bars are SD. One-way ANOVA test were performed for D. *p < 0.05.

