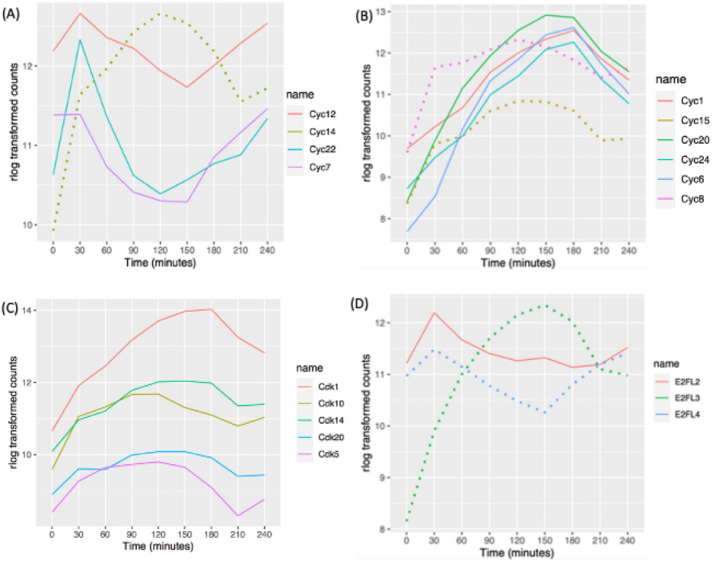
FIGURE 5:
Oscillating cyclin, CDK, and E2F mRNA abundance profiles. (A) Cell cycle–regulated expression of cyclin D gene family members. (B) Cell cycle–regulated expression of cyclin A/B genes. Solid lines: pattern 1 for cyclin A/B gene family members; dotted lines: pattern 2 for cyclin A/B gene family members. (C) Cell cycle–regulated CDK genes. (D) Cell cycle–regulated E2Fs. Solid line: potential E2F activator; dotted lines: potential E2F repressors and atypical E2F with two DNA-binding domains.

