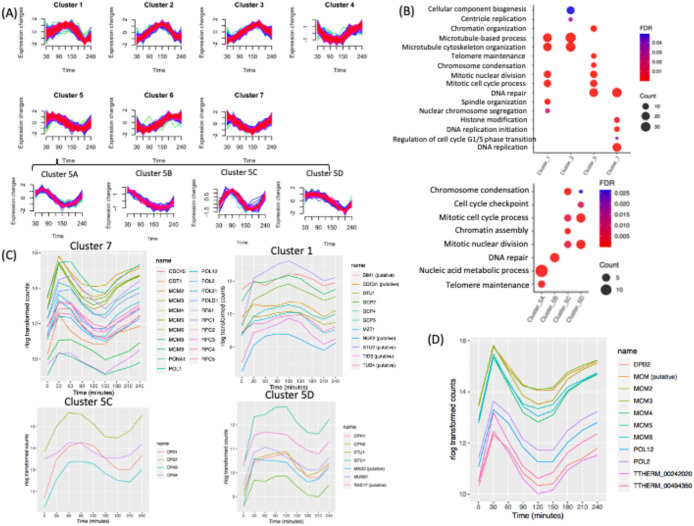
FIGURE 6:
Cluster and GO enrichment analysis. (A) Clusters of seven distinct periodically gene expression profiles and four subclusters (5A–D). (B) Overrepresented GO biological processes of four clusters. Overrepresented GO biological processes of subclusters within cluster 5. (C) Gene expression profiles of DNA replication protein-coding genes within cluster 7. Gene expression profile of mitotic genes within cluster 1. Gene expression profile of mitotic genes of subcluster 5C. Gene expression profile of mitotic and cell cycle checkpoint genes of subcluster 5D. (D) Coregulation analysis of the MCM6 mRNA cell cycle profile: top 10 coregulated genes.

