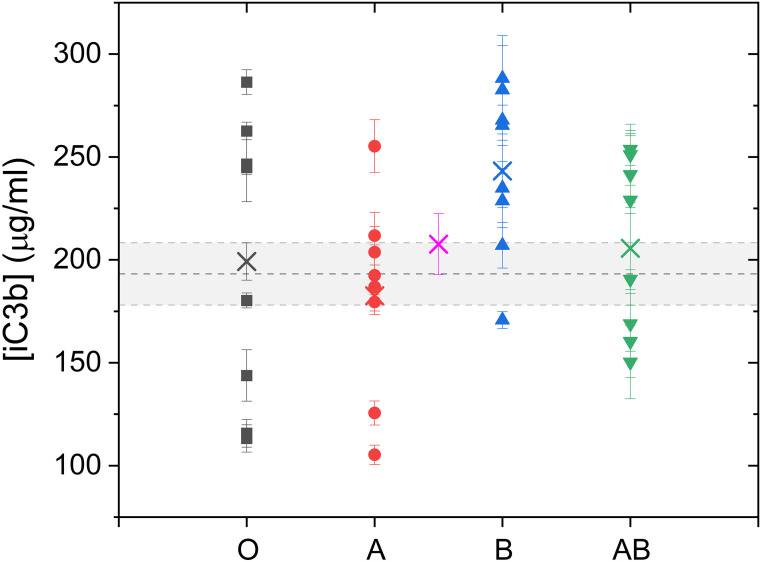
Figure 4.
Variability of iC3b complement fragment determined in healthy donors compared to pooled serum.
Notes: The dot plot demonstrates individual responses after activating the human iC3b complement fragment in sera of 32 healthy donors. The sera were incubated with 10 units/mL CV for 1h and compared with commercially available pooled serum. The horizontal grey bar represents the range of the average amount of iC3b cleavage in pooled serum. The mean value of 32 responses (pink cross) shows that this value is still in range of pooled serum, which was experimentally obtained.

