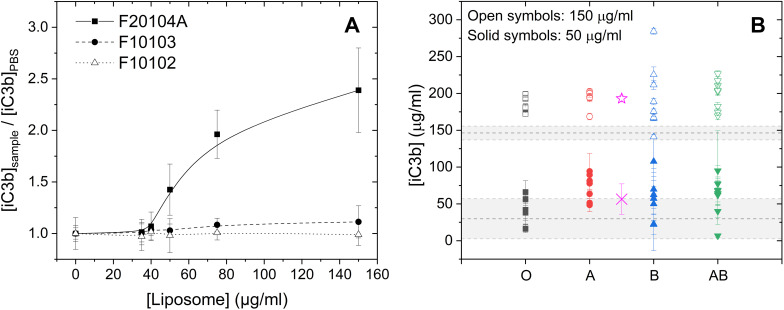
Figure 6.
Liposome inducing changes in complement activation product iC3b measured in sera of healthy donors.
Notes: (A) Dose response curves of activation of the complement system triggered by three different liposomes in pooled serum of healthy donors. (B) Complement activation by two concentrations of the liposome with the highest potential to induce an adverse immune response evaluated in sera from individual healthy donors. Data are grouped by blood type. The average of iC3b released upon exposure to 50 and 150 µg/mL of F20104A liposome is represented by the open pink star and the cross, respectively. The horizontal lines correspond to the iC3b levels observed in pooled sera from healthy donors after exposure to 50 µg/mL (bottom line) and 150 µg/mL (top line) of liposomes. The grey band represents the responses in pooled serum.

