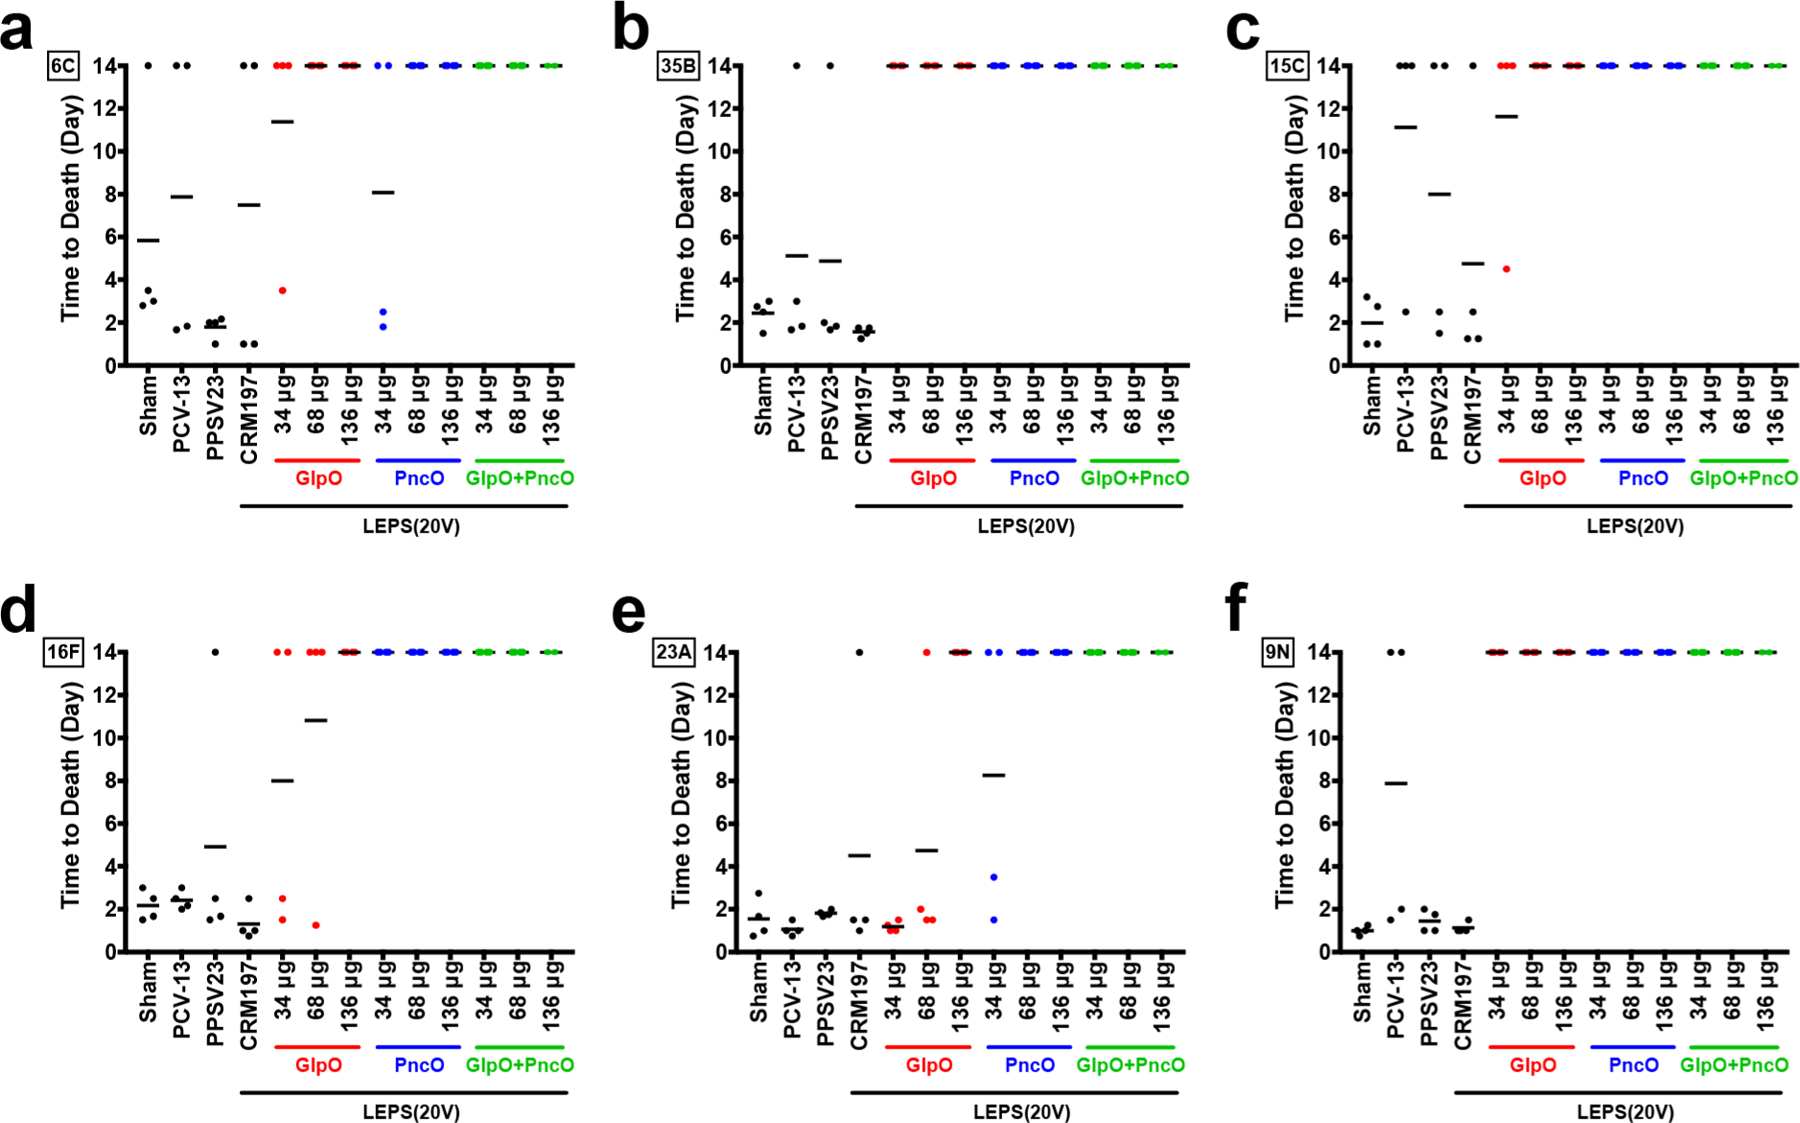
Figure 2.

Time to death in BFR pneumonia challenge model. Serotypes tested included 6C (a), 35B (b), 15C (c), 16F (d), 23A (e), and 9N (f). Four CD-1 mice were vaccinated with a sham control, PCV13, PPSV23, and LEPS(20V) with CRM197, GlpO, PncO, and GlpO+PncO. Doses represent micrograms of each protein (34, 68, or 136 μg). Each dot represents an individual mouse, and black lines represent the average time to death.
