Figure 6.
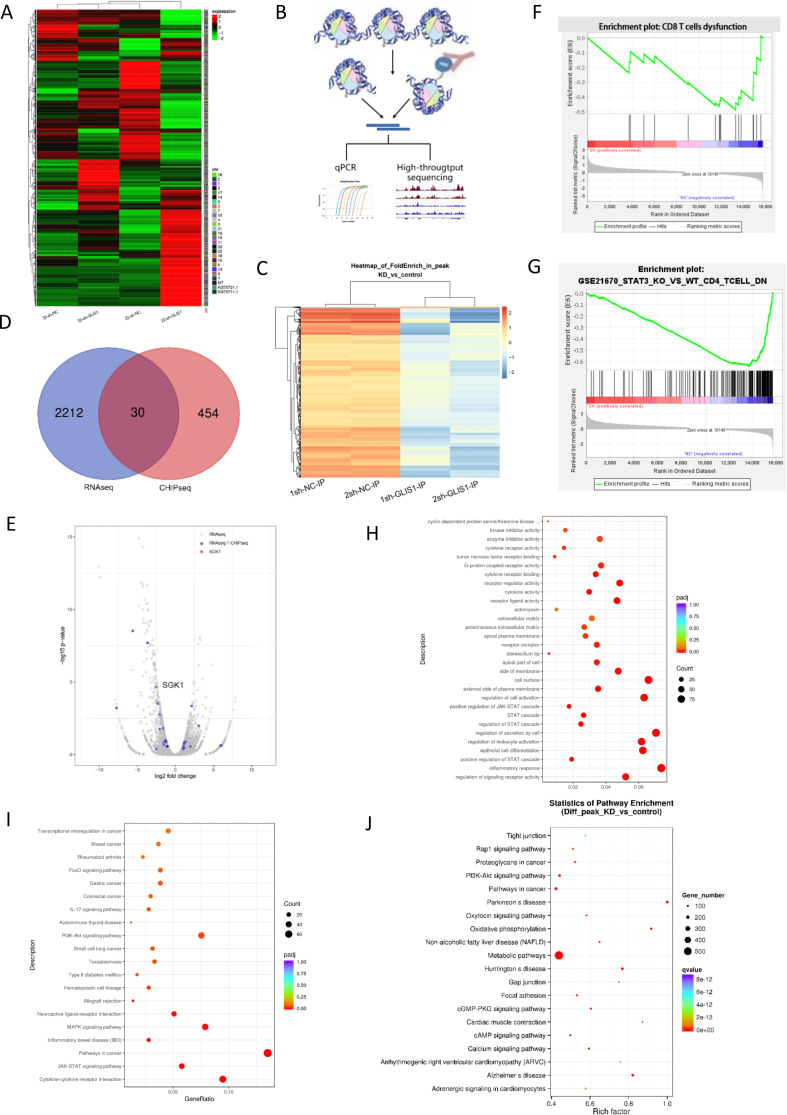
CHIP and RNA sequence analysis when GLIS1 was knockdown in CD8+ TIL from HCC patients. (A) RNA transcriptome sequencing was used to assess the different mRNAs of sh-NC and sh-GLIS1 group. 22 and 32 represented two groups.Heatmap was presented. (B) Schematic diagram of the experimental steps of CHIP-seq. (C) CHIP sequencing was used to assess genes regulated by GLIS1 transcription. 1 and 2 represented two groups.Volcano map was presented. (D) We cross-analyzed the results of RNA sequencing and CHIP to search for common genes shared by the two sequencing. (E) Volcano plot showing cross-analyzed genes including SGK1. (F) GSEA analysis of total RNA-seq, indicating the different genes were enriched in CD8+ T exhaustion. (G) Pathway analysis of mRNAs in sh-NC and sh-GLIS1 group. (H) GO analysis of RNA-seq22. (I) KEGG analysis of RNA-seq22. (J) KEGG analysis of CHIP-seq. CHIP, chromatin immunoprecipitation; HCC, hepatocellular carcinoma.

