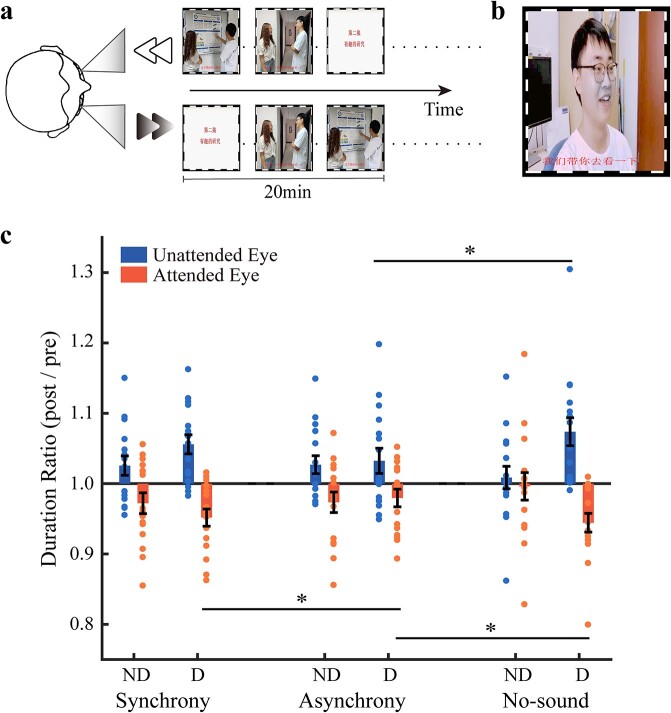
Fig. 1.
Illustration of the “dichoptic-backward-movie” paradigm (a), the blob target (see the gray region around the mouth in this example) in experiment 1b (b), and the mean duration ratios for the 3 adaptation conditions in experiment 1a (c). The circles show the individual data. Error bars represent standard errors of means. Asterisks represent significant differences between different adaptation conditions (FDR correction, *P < 0.05). For demonstration purpose only, the images with human faces shown in this figure are photographs taken from 2 graduates of our lab who gave permission to publish their identifiable images. The movie images we actually used in the experiment are not shown here due to copyright concerns.

