
Fig. 10.
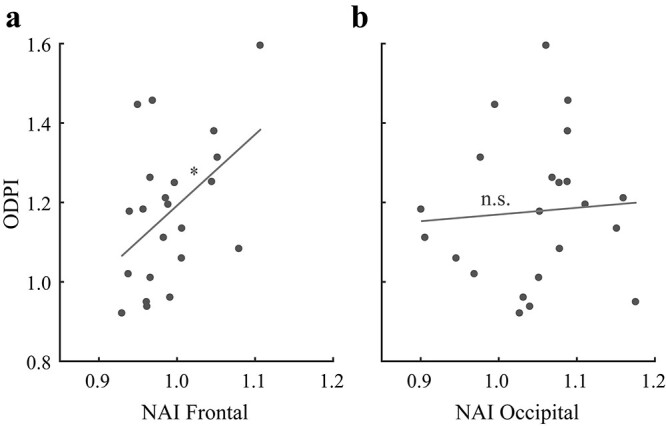
Illustration of the correlations between the ODPI and NAI in the (a) frontal and (b) occipital sites during adaptation. Asterisks represent significant correlations between the 2 conditions (*P < 0.05; n.s. P > 0.05).
Official websites use .gov
A
.gov website belongs to an official
government organization in the United States.
Secure .gov websites use HTTPS
A lock (
) or https:// means you've safely
connected to the .gov website. Share sensitive
information only on official, secure websites.
Illustration of the correlations between the ODPI and NAI in the (a) frontal and (b) occipital sites during adaptation. Asterisks represent significant correlations between the 2 conditions (*P < 0.05; n.s. P > 0.05).