
Fig. 3.
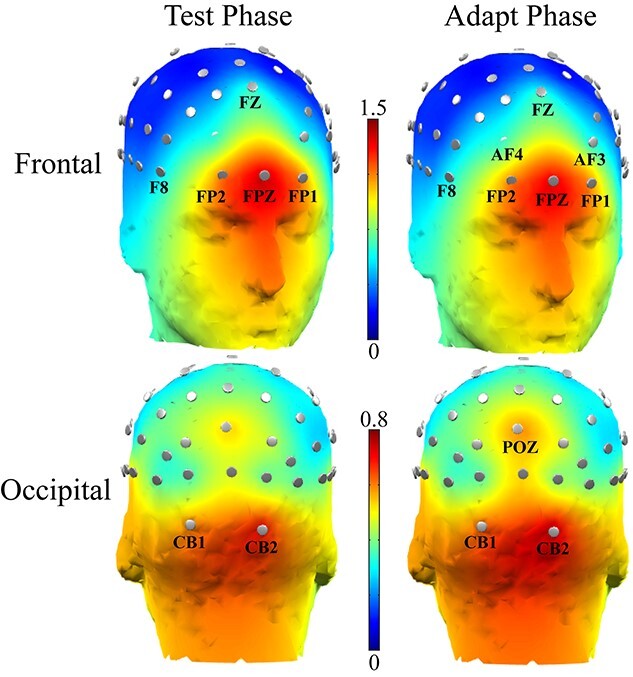
Average topography for the test phase and adaptation phase. The electrodes indicated in the figure are the selected EOIs.
Official websites use .gov
A
.gov website belongs to an official
government organization in the United States.
Secure .gov websites use HTTPS
A lock (
) or https:// means you've safely
connected to the .gov website. Share sensitive
information only on official, secure websites.
Average topography for the test phase and adaptation phase. The electrodes indicated in the figure are the selected EOIs.