
Fig. 4.
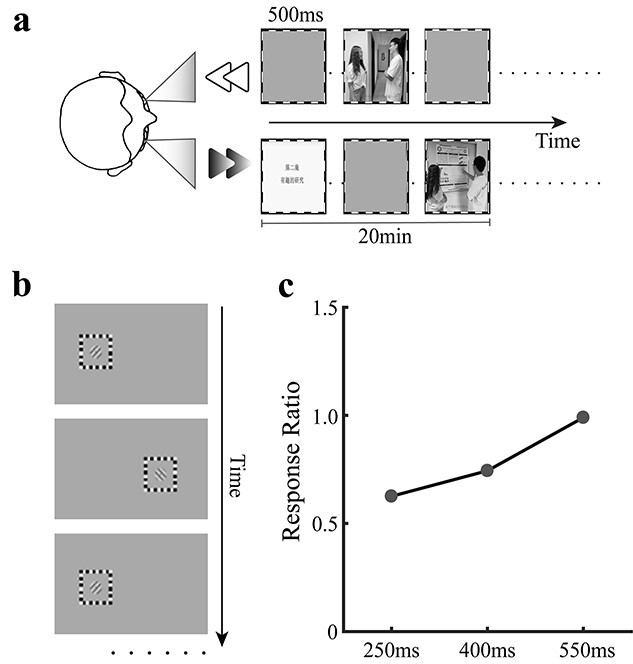
Diagrams for (a) the alternating presentation of dichoptic movie in experiment 3 and (b) the interval testing tasks. Typical results of the interval test for one participant (c). The response ratio was calculated by dividing the switch rate of responses by the alternation rate of grating presentations. A response ratio of 1 means that subject did not experience binocular rivalry at that interval. Response ratios smaller than 1 indicate the existence of binocular rivalry.