
Fig. 6.
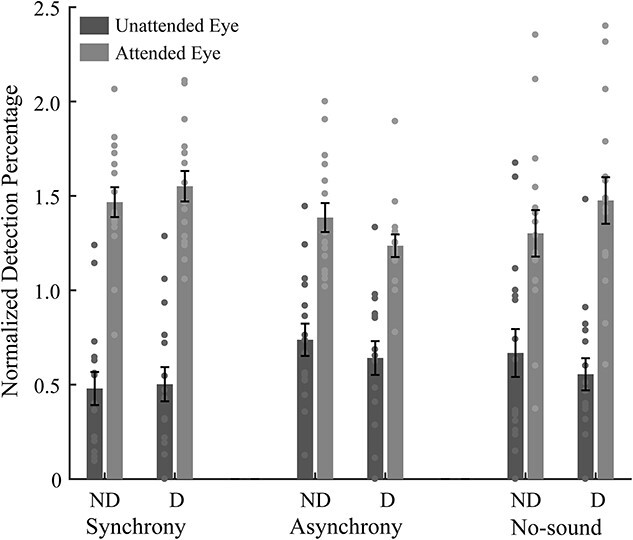
Illustration of the normalized detection percentages for the 3 adaptation conditions of experiment 1b. The bars show the grand average normalized detection percentages for each eye and each condition. D and ND mean presenting the regular movie to the dominant or nondominant eye, respectively. The circles show the individual data. Error bars represent standard errors of means.