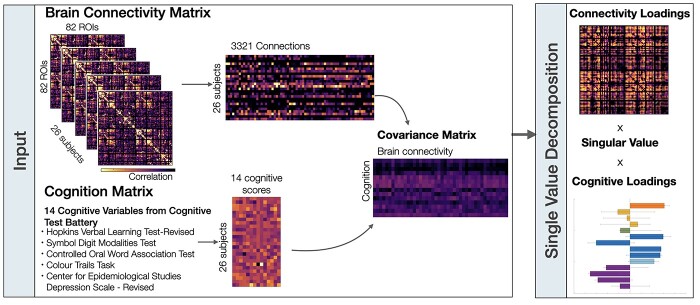
Fig. 1.
Overview of partial least squares analyses. Two partial least squares analyses were performed on both brain connectivity data sets (i.e. hemodynamic connectivity and metabolic connectivity) separately. The brain connectivity matrices were first sorted by stacking the upper triangle elements from each participants’ matrices. The rows of the brain connectivity and cognitive matrices correspond to participants and the columns correspond to either the brain connections or cognitive scores. The covariance between the brain connectivity and cognition matrices was computed across participants, resulting in a rectangular connectivity-cognition covariance matrix. This covariance matrix was then subjected to singular value decomposition.

