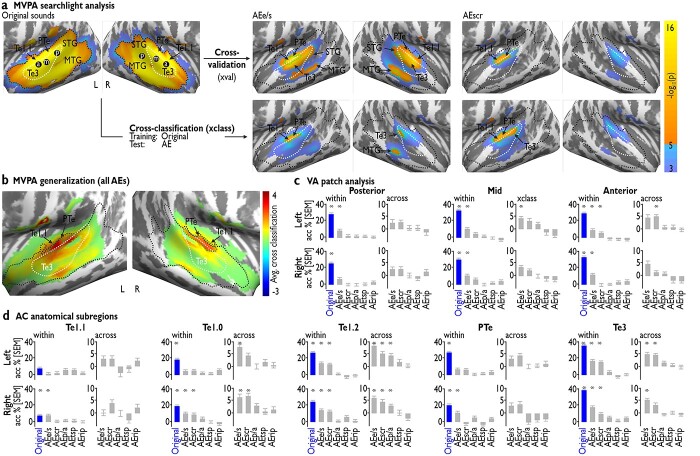
Fig. 3.
Results of the MVPA. a) The upper row shows cross-validated classifications of [voice versus nonvoice] for the original sounds and AEs. Black outlines are taken from the left-most panel (original sounds), indicating that all significant voxels within the AEs are contained within the original VA. The lower row shows the cross-classification approach with training on the original sounds and testing on the AEs. Significant voxel clusters from the cross-classification approach are marked with a green dashed line and displayed in the upper row. White outlines indicate Te3 as an anatomical landmark in the AC. The 3 VA patches [posterior (p), mid (m), anterior (a)] are taken from Pernet et al. (2015) and marked by black dots in each hemisphere. b) Average cross-classification results, highlighting that subareas of the original VA (black dashed line) in primary AC and PTe generalize the strongest from the original sounds to the AEs. c) Cross-validation accuracy (relative to the chance level of 50%) within each sound set (“within”) and cross-classification accuracy from the originals to AEs (“across”) for the 3 VA patches (posterior, mid, anterior). d) Cross-classification results equivalent to (c), but on anatomically defined subregions of AC instead of a searchlight approach. L, left; R, right; Te, temporal auditory regions. Asterisks indicate significant P < 0.05 (FDR corrected) above chance level classification.

