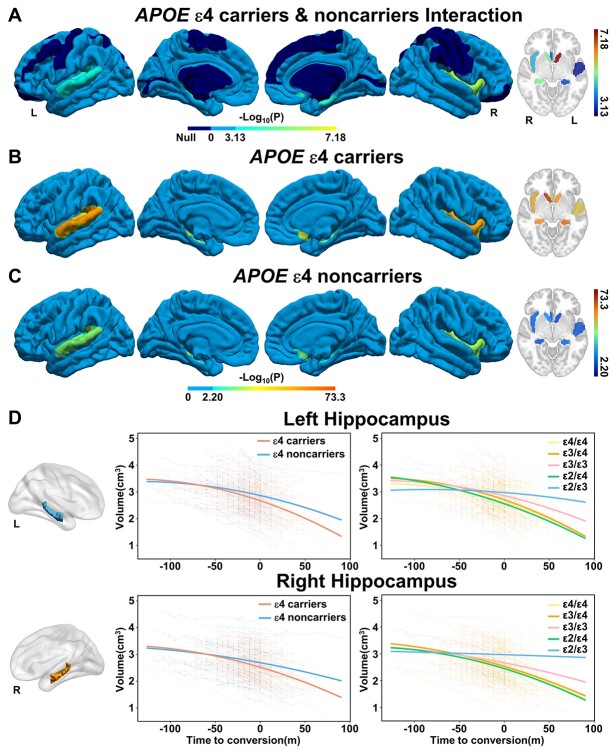
Fig. 5.
Effects of APOE ε4 on the cerebral longitudinal atrophic trajectories from aMCI to AD. (A) The cortical maps of difference in cerebral longitudinal atrophic trajectories between APOE ε4 carriers and noncarriers. A linear mixed-effects model was used to estimate the effect of APOE polymorphism on the quadratic cerebral atrophic trajectories as a function of time to AD conversion (Fig. < 0.05/68, Bonferroni correction). The color bar represents the -log10(P) values. Dark blue represents non-significant. Panels (B) and (C) represent the quadratic cerebral atrophic maps as a function of time to AD conversion in APOE ε4 carriers and noncarriers, respectively. (D) The atrophic trajectories of the hippocampus during the conversion in APOE ε4 carriers and noncarriers (left panels) and in five APOE genotypes (right panels). Abbreviations: APOE = apolipoprotein E; L = left; m = month; R = right.

