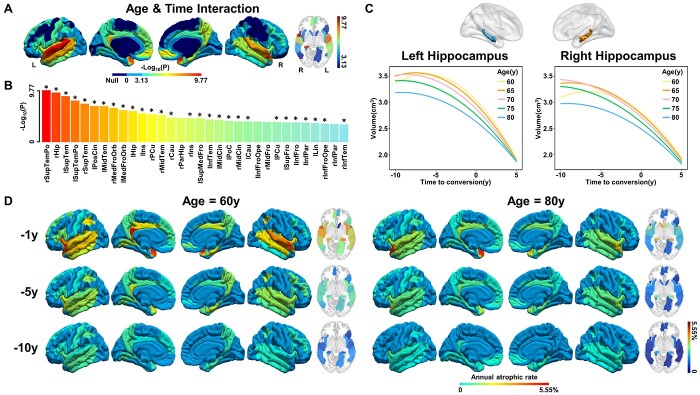
Fig. 6.
Effects of age on the cerebral longitudinal atrophic trajectories from aMCI to AD. Panels (A) and (B) represent the cerebral regions with significant Age×Time interaction effects on cerebral atrophy. A linear mixed-effects model was used to estimate the quadratic interaction between age and time to AD conversion on GMV (P < 0.05/68, Bonferroni correction). Asterisk (*) indicates cerebral regions that the AAL3 atlas can validate. (C) The quadratic atrophic trajectories of the hippocampus as a function of time to AD conversion at an interval of five years between 60 and 80 age. (D) The maps of average annual atrophic rate within 1 year, 5 years, and 10 years prior to AD conversion at age 60 (left panel) and 80 (right panel) years. The full names of the brain regions are shown in Supplementary Table 8. Abbreviations: GMV = gray matter volume; L = left; R = right; y = year.

