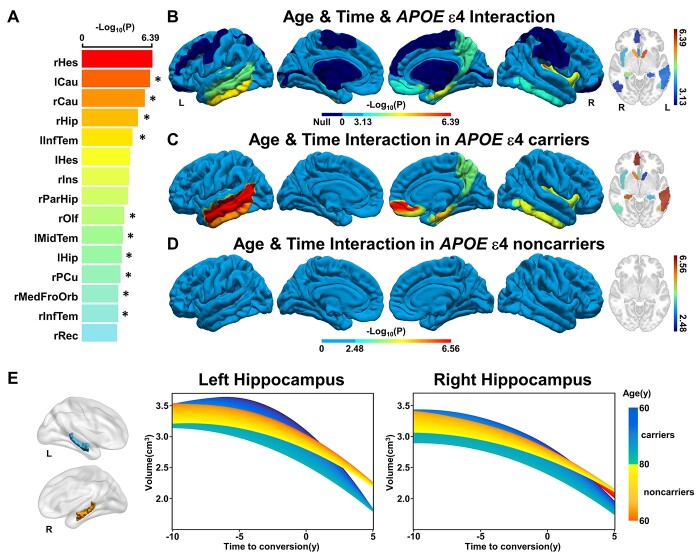
Fig. 7.
Effects of APOE ε4 and age on the cerebral longitudinal atrophic trajectories from aMCI to AD. Panels (A) and (B) represent the cerebral regions with significant APOE×Age×Time interaction effects on the cerebral atrophy, respectively. A linear mixed-effects model was used to estimate the quadratic interaction between APOE, age, and time to AD conversion on GMV (P < 0.05/68, Bonferroni correction). Asterisk (*) indicates cerebral regions that the AAL3 atlas can validate. (C) and (D) represent the effect of aging on the quadratic cerebral atrophic trajectories as a function of time to AD conversion in APOE ε4 carriers and noncarriers, respectively. (E) The effects of APOE polymorphism and aging on the quadratic atrophic trajectories of the hippocampus as a function of time to AD conversion. The full names of the brain regions are shown in Supplementary Table 9. Abbreviations: APOE = apolipoprotein E; GMV = gray matter volume; L = left; R = right; y = year.

