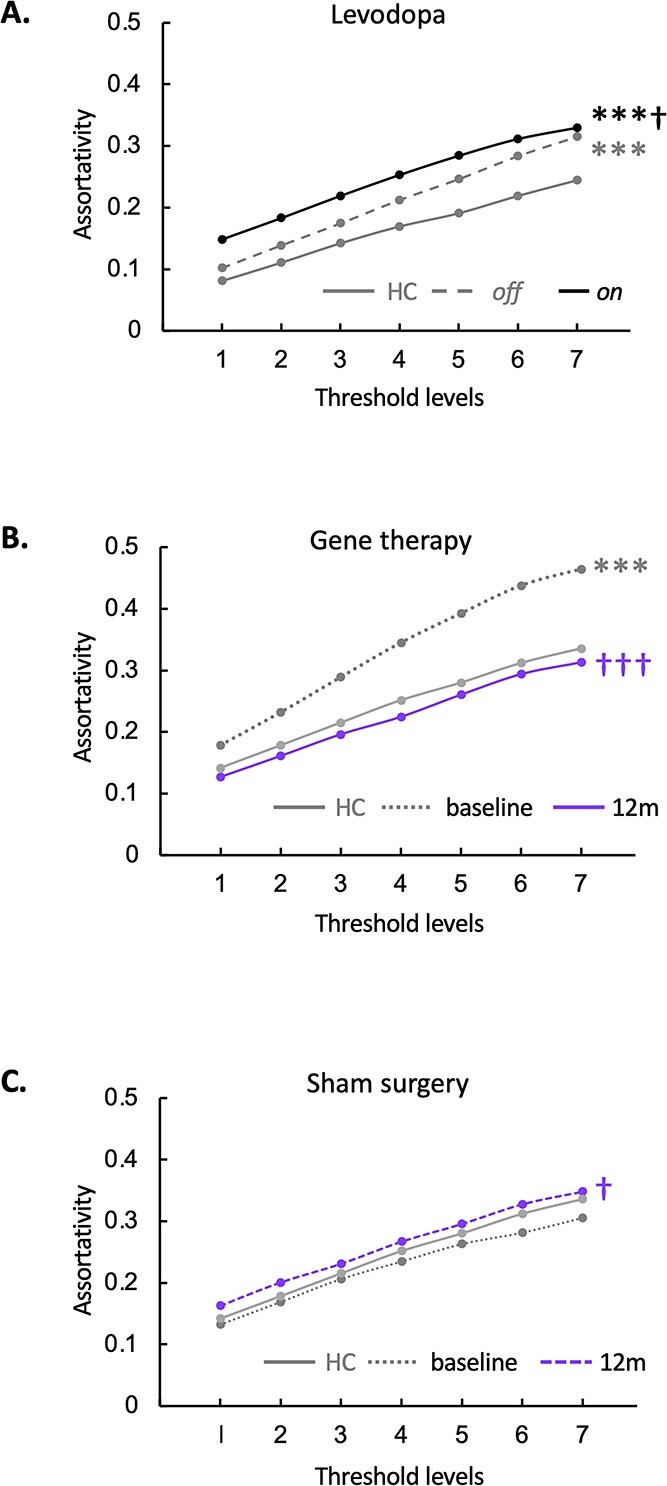
Fig. 5.

PDRP network assortativity: Changes with treatment. A) Levodopa infusion: In the PDRP space, assortativity was elevated in the unmedicated (“off”) state compared to the HC group (Supplementary Table S2D) but rose even higher during intravenous levodopa infusion (“on”). (***P < 0.001, “off” or “on” compared to HC. †P < 0.05, “on” compared to “off.”) B) STN AAV2-GAD: PDRP assortativity was elevated at baseline in the gene therapy group (Supplementary Table S2E) compared to HC subjects but declined by 12 months after gene therapy. C) Sham surgery: In this group (Supplementary Table S2E), PDRP assortativity increased relative to baseline at 12 months but did not differ significantly from HC at either time point. (Levels 1–7 correspond to cutoff graph thresholds of r = 0.3–0.6 in increments of 0.05. ***P < 0.001 for baseline or 12 months vs. HC. †P < 0.05 †††P < 0.001 for baseline vs. 12 months.)
