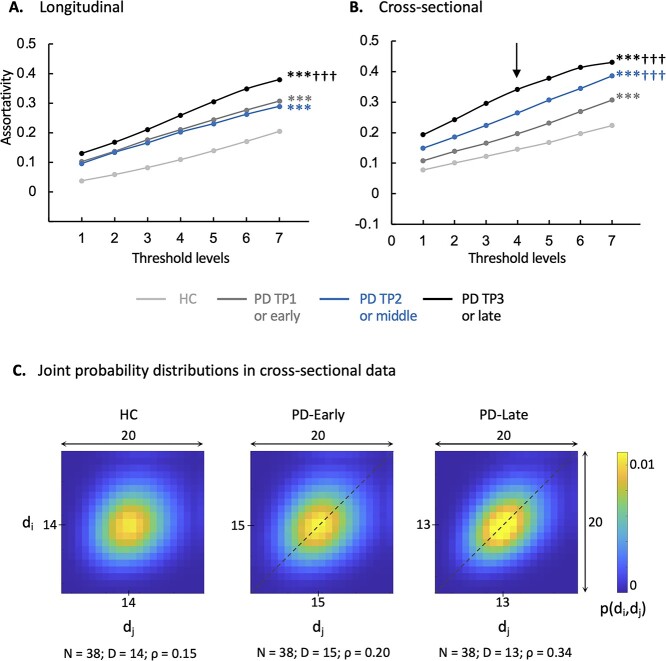
Fig. 2.
PDRP assortativity increases with disease progression. A) Longitudinal PD cohort: Assortativity in the PDRP space rose over time in PD patients (Supplementary Table S2A). B) Cross-sectional PD cohort: PDRP assortativity was elevated in the 3 PD groups compared to HC (Supplementary Table S2B). Values were higher with each successive 4-year increment in disease duration. (Levels 1–7 correspond to cutoff graph thresholds of r = 0.3–0.6 in increments of 0.05. ***P < 0.001 compared to HC; †††P < 0.001 compared to PD-TP1 A) or PD-early B).) C) 2D displays of the joint probability distribution of degree–degree correlations in the PDRP space for the groups in B). Whereas the HC group showed a relatively symmetrical distribution of probability (P) values around the mean (center), the PD-early and PD-late groups exhibited an assortative connectivity patterns: The density of high P values along the main diagonal (“dashed lines”) represents a tendency for PDRP connections to link nodes with similar degree centrality. (The joint probability distribution for degree–degree correlations in the PDRP space was generated at threshold level 4 [“vertical arrow” in B)]. The color scale represents the computed probability that a randomly selected link connects nodes with degrees di and dj (see Materials and methods). Because mean degree centrality differed for the 3 groups, the centers of the joint distributions also varied. For comparable visualization, the x- and y-axes were shifted so that the mean value for each group was at or near the center of the corresponding display. N = number of nodes; D = mean degree centrality; ρ = assortativity coefficient.)

