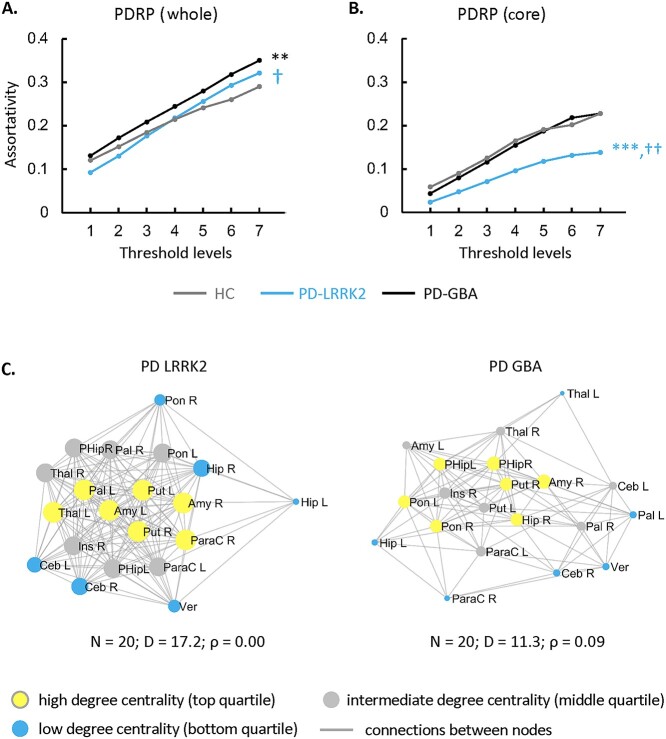
Fig. 3.
Influence of genotype on PDRP assortativity. A) PD-GBA patients showed higher assortativity than PD-LRRK2 or HC subjects in the PDRP space as a whole. B) In the PDRP core zone (see text), PD-LRRK2 patients showed lower assortativity than HC or PD-GBA subjects. (Levels 1–7 correspond to cutoff graph thresholds of r = 0.3–0.6 in increments of 0.05, corrected for multiple comparisons [see Materials and methods]. **P < 0.01, ***P < 0.001 for PD-LRRK2 or PD-GBA relative to HC. †P < 0.05, ††P < 0.01 for PD-LRRK2 relative to PD-GBA.) C) Connectivity patterns in the PDRP core zone for the genotypic patient groups in B). PD-LRRK2 (“left”) exhibited a neutral pattern, with a combination of assortative and disassortative connections linking subgraph nodes. By contrast, in PD-GBA (“right”), the connectivity pattern for the subgraph was assortatitve at the same threshold (|r| ≥ 0.3). (Core nodes are represented by disks, with radius proportional to the corresponding degree centrality. Yellow = high degree (top quartile); blue = low degree (bottom quartile); gray = intermediate degree (middle quartile). Connections were thresholded at |r| ≥ 0.3 and displayed as gray lines. N = number of nodes; D = degree centrality; ρ = assortativity.)

