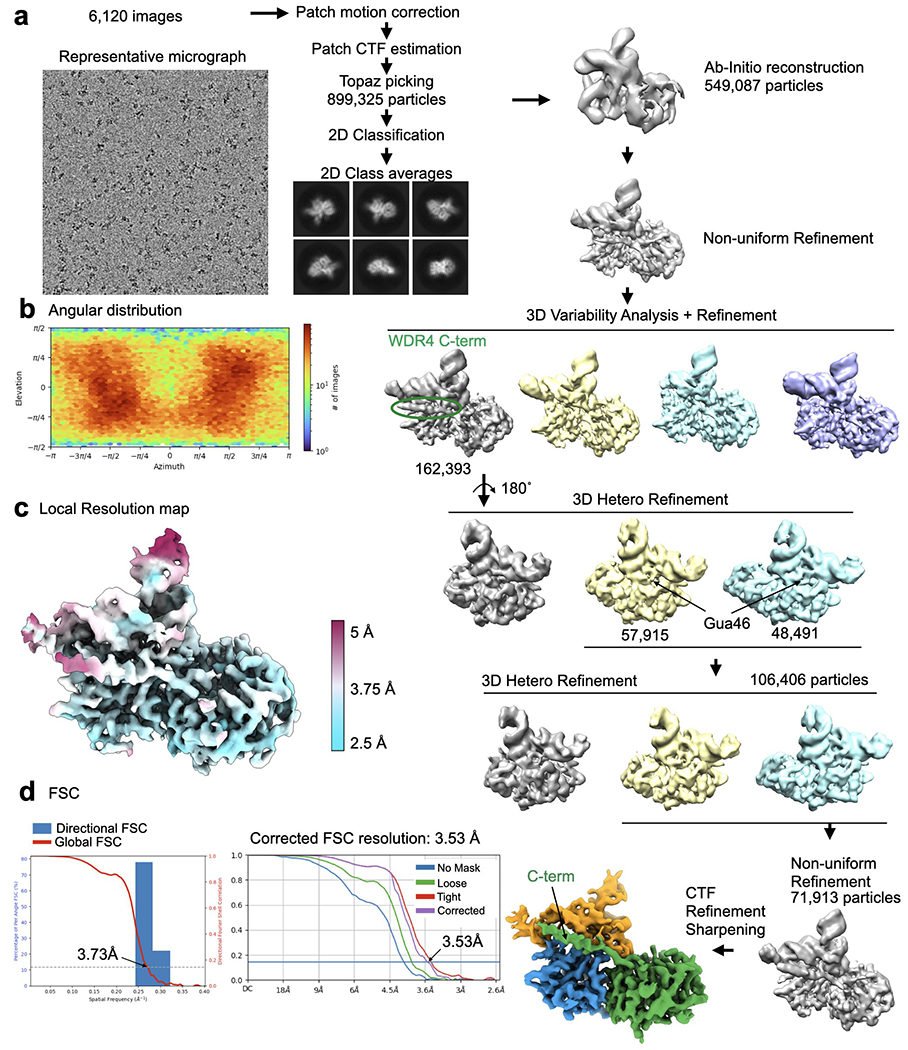
Extended Data Fig. 4: Cryo-EM data processing for the METTL1-WDR4-tRNALys-SAH structure.

a, Cryo-EM data processing workflow. Left, a representative micrograph of the METTL1-WDR4-tRNA-SAH complex particles. A total of 6,120 images were used for picking and 2D classification. 2D class averages that showed high-resolution features were used for further 3D analysis using Cryosparc. 3D variability analysis identified a population of particles that showed consistent density for the WDR4 C-terminal helix and several rounds of 3D Heterogeneous Refinement identified particles showing prominent density for G46. b, Angular distribution plot. c, Local resolution map shown with colors on the sharpened map. d, Directional FSC plot and FSC curves showing the resolution at 0.143 cutoff.
