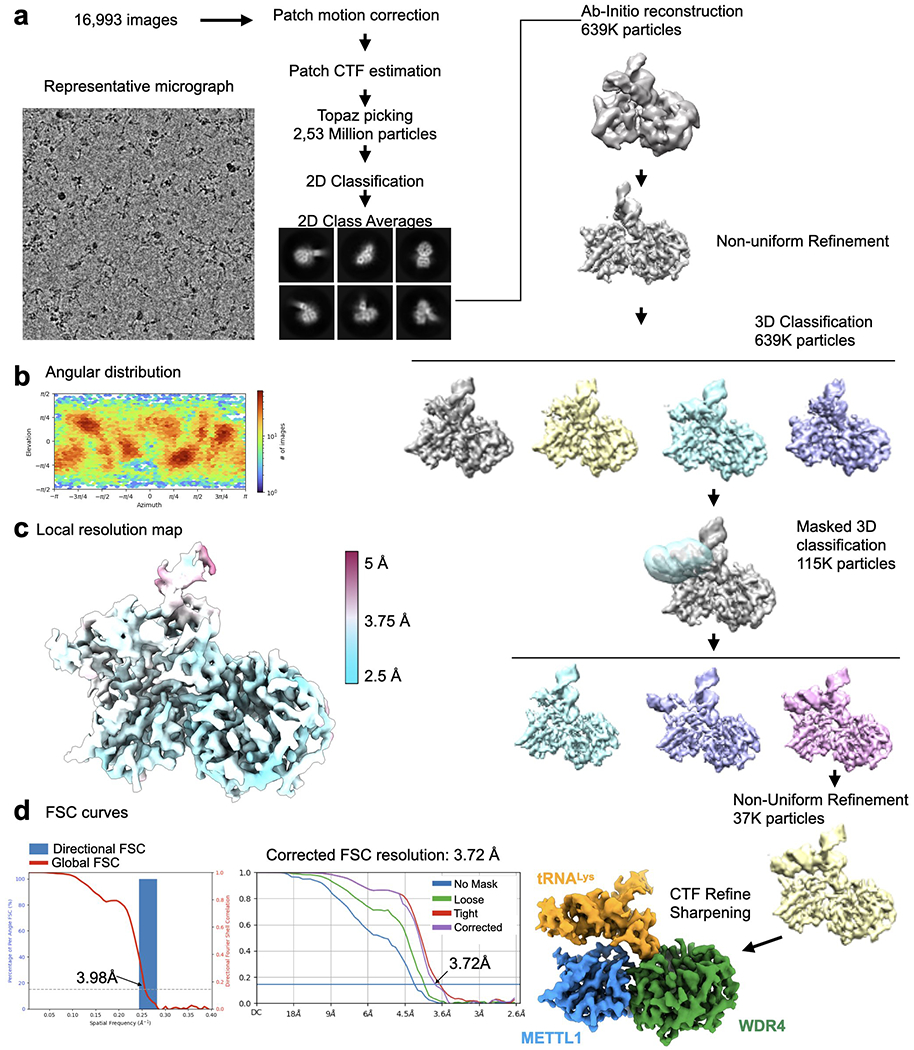
Extended Data Fig. 2: Cryo-EM data processing for the METTL1-WDR4-tRNALys structure.

a, Cryo-EM data processing workflow. Left, a representative micrograph of the METTL1-WDR4-tRNA complex particles. A total of 16,993 images were used for picking and 2D classification. 2D class averages that showed high-resolution features were used for further 3D analysis using Cryosparc. 3D classification identified different populations that showed partial or no density around the anticodon arm. 3D classification applying the indicated mask revealed a homogeneous population of particles showing contiguous density in the tRNA region. b, Angular distribution plot. c, Local resolution map shown with colors on the sharpened map. d, Directional FSC plot and FSC curves showing the resolution at 0.143 cutoff.
