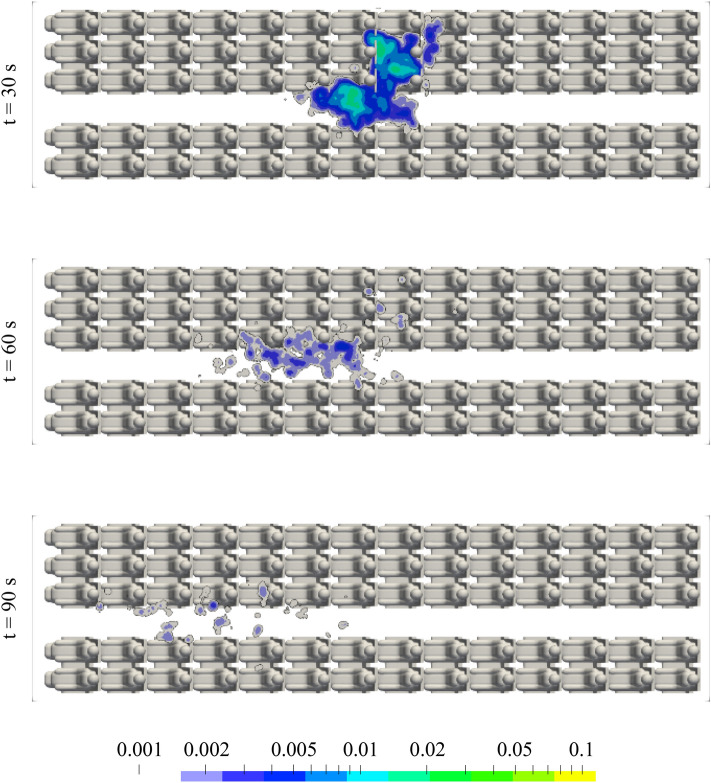
Fig. 15.
Aerosol concentration in the height of the breathing zone for CDV @900 l/s at different instants in time predicted in RANS simulations. A concentration value of 1 corresponds to the initial aerosol concentration in front of the source at t = 0 s. Aerosol source on seat 8D. A log-normal distribution with a median of 5 µm and a width of 0.77 σ was taken as the initial particle size distribution. All manikins were heated at 75 W each

